

Scan Modes
There are 2 types of scan modes: full dataset scan mode and incremental scan mode.
Full Dataset Scan Mode
Full dataset scan mode means that the monitor scans the entire table at every run. It is suited for dimension tables that do not contain any time column.
Incremental Scan Mode
Incremental scan mode means that the monitor only scans the rows added since the last monitor run. It is particularly suited for append-only tables (such as fact tables) that contain a time column.
There are parameters to consider while configuring an incremental mode:
Time Window Column
This is the column used to query data incrementally. You can choose "Auto-detect" to let Sifflet select the column automatically.
Auto-Detect
Sifflet ranks the dataset columns based on the following criteria (in order) and selects the best one:
- Partitioning: The column is a partitioning column.
- Column type: Date and Time Data Types (e.g., DATE, DATETIME, TIMESTAMP, ...) are preferred over columns that need casting, such as String Data Type (e.g., VARCHAR, ...) containing dates or Numeric Data Types (e.g., FLOAT) containing a Unix timestamp. Note that columns that need casting are detected by the AI-generated metadata process.
- Granularity:
- If the Time-based Data Aggregation requires DATETIME granularity (hourly and below) → prefers DATETIME fields over DATE.
- If the Time-based Data Aggregation requires DATE granularity (daily and above) → accepts both.
- Field Name Pattern Matching: Searches for these patterns in order: "insert", "ingest", "create", "update", "add", "date". So a column named
inserted_atbeatscreated_at, which beatsupdated_at, etc. - Fallback: 1st column.
Time-Based Data Aggregation
The Time-based Data Aggregation describes intervals between points that are checked for anomalies.
This is the first parameter you should consider when establishing a monitor based on time. When you select daily Time-based Data Aggregation, Sifflet checks one data point per day. Time-based Data Aggregation also affects the maximum training window for machine learning (ML) monitors.
Read more about Time-based Data Aggregation
Schedule vs Time-based Data AggregationA monitor's Run Schedule does not need to be equal to its Time-based Data Aggregation parameter. For example, you may choose to run a monitor once a week (Schedule: @weekly), with a daily data point creation frequency (Time-based Data Aggregation: daily).
Read more about Time-based Data Aggregation.
Optimize your run frequencyAdapt your run frequency to the refresh frequency of your data. If your data is updated by batch at 2am every day, running your monitors every hour would be suboptimal.
Time Offset
By default, Sifflet runs monitors on today's date. In some cases, pipelines are configured so that they update with a delay: e.g., a sales table updated every morning with the data for T-2 days. To take this into account, you can change the reference date by using an OFFSET parameter.
The offset typically represents the data delays. If the table contains only orders from 2 days ago, setting an offset of 2 days ensures that the monitor does not alert on empty or partial days.
Time Offset with other Time ParametersAdding an offset does not alter the duration of the Time-based Data Aggregation or the rolling aggregation window; it only shifts it into the past by the given offset.
Dataset- vs Monitor-Level ParametersTime Offset parameters can also be set at the dataset level. If defined at the dataset level, their values are used as defaults for all newly created monitors accepting those parameters. See this table for details.
Lookback Period
By default, Sifflet monitors run incrementally and only query new data.
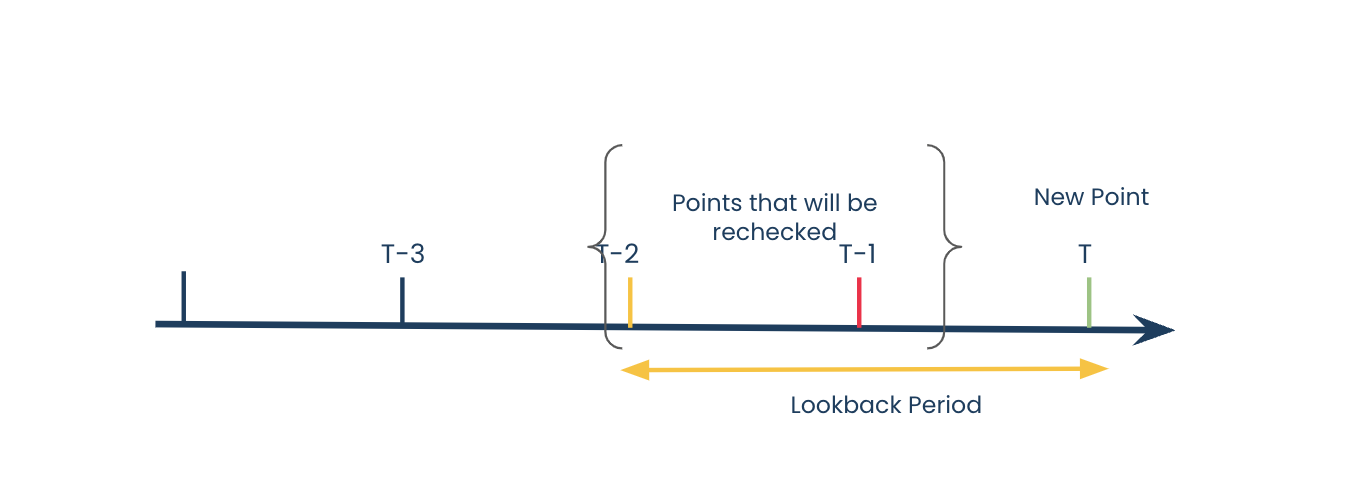
However, there are scenarios where past data is susceptible to change and you want today's run of the monitor to also check previous days (or other Time-based Data Aggregation intervals).
This is where the Lookback Period comes in. Use it to specify a time window for which Sifflet rechecks previous data points for changes. Points that were previously within range but whose value now appears as an anomaly are included in the run's result.
First Run Time Window
This parameter determines the amount of data the monitor queries during its first run.
Rolling Aggregation (Optional)
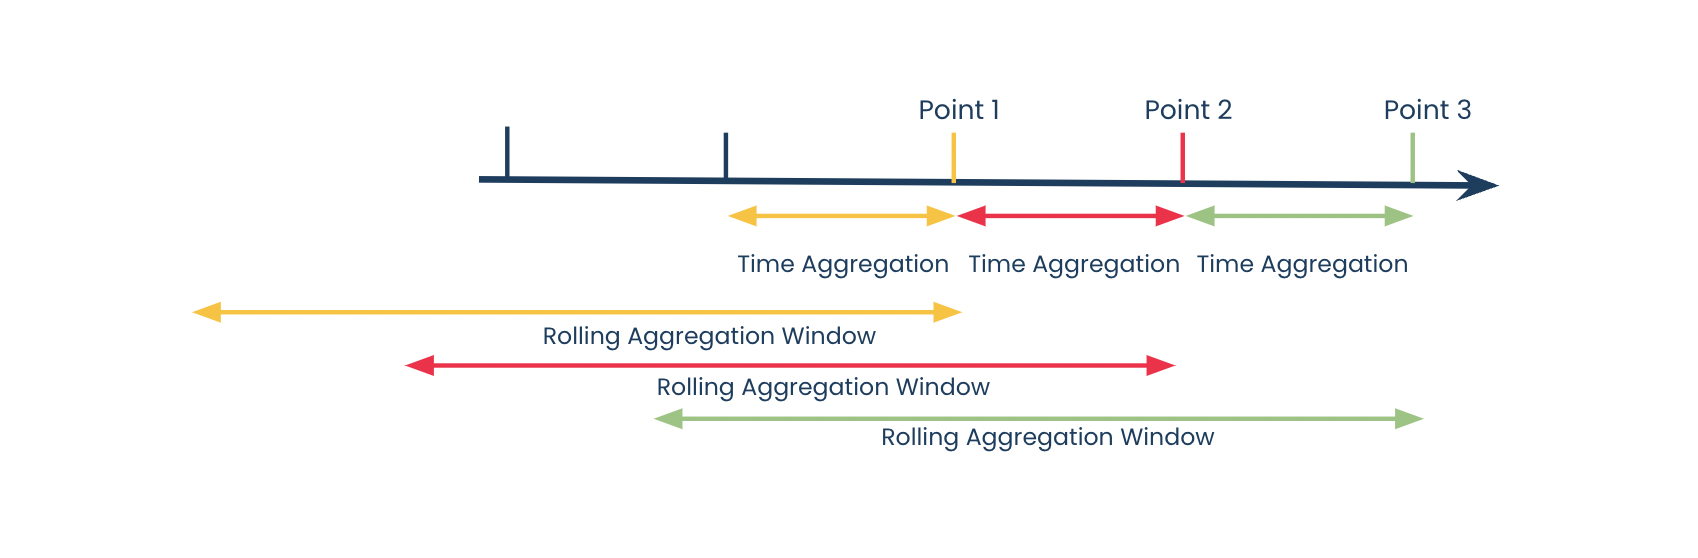
Rolling Aggregation lets you set a custom time interval for every point that Sifflet checks. When rolling aggregation is OFF, the time interval matches the Time-based Data Aggregation. This means that typically, a daily point represents one day's worth of data.
However, there are scenarios where you might want a daily point that represents something other than a day, such as a daily point representing the rolling sum over the last 7 days.
Rolling Aggregation on Static MonitorsRolling Aggregation is not available for static monitors. Static monitors do not differentiate between a data point and a run and do not have a Time-based Data Aggregation parameter, so each run of the monitor represents one data point.
However, static monitors have a time window parameter that acts in the same way as the rolling aggregation parameter and specifies the time window being checked.
Excluded Dates (Optional)
Select a calendar (e.g., France Public Holidays, Weekends) to exclude specific days from alert and incident creation.
Time Parameters as Code
Full Dataset Scan
parameters:
  kind: <MonitorKind>
  threshold:
    sensitivity: Low
  # no timeWindow
If you do not set a time window parameter, the monitor scans the entire table at each run.
Incremental Scan
timeWindow: object that represents the time window configuration. When absent, the monitor uses full dataset scan mode. When present, the monitor uses incremental scan mode.
timeWindow.field: the time field used to incrementally query data.
timeWindow.frequency: the Time-based Data Aggregation configuration, in ISO 8601 format. P1D: Daily. P1W: Weekly. P1M: Monthly. PT1H: Hourly. PT30M: every 30 minutes. PT20M: every 20 minutes. PT15M: every 15 minutes.
timeWindow.firstRun: the amount of data to query in the first run. ISO 8601 format
timeWindow.offset: the offset that represents the delay between the data and the present. Typically it should match the granularity of the aggregation. Days for Daily, Hours for Hourly etc. ISO 8601 format
parameters:
  kind: <MonitorKind>
  timeWindow:
    field: auto
    firstRun: P365D
    offset: P1D
    frequency: P1D
Incremental config for: an automatically selected time field. 1 point per day, with an offset of 1 to only track completed days. 365 days queried in the first run to build the graph and the prediction model.
timeWindow.rollingTimeWindow. An ISO 8601 format representation of the rolling time window each time represents. P7D makes each point a rolling aggregation over the last 7 days for each point.
parameters:
  kind: <MonitorKind>
  timeWindow:
    field: order_date
    firstRun: P365D
    offset: P1D
    frequency: P1D
    rollingTimeWindow: P7D
Incremental config for: an order_date time field. 1 point per day, which represents an aggregation over the previous 7 days from that point's date, with an offset of 1 to only start from completed days. 365 days queried in the first run to build the graph and the prediction model.
timeWindow.deltaQuerying. An ISO 8601 format representation of the lookback period of the monitor. P7D checks the last 7 daily data points each run, rather than checking only a single data point per day.
parameters:
  kind: <MonitorKind>
  timeWindow:
    field: order_date
    firstRun: P365D
    offset: P1D
    frequency: P1D
    deltaQuerying: P7D
Updated 13 days ago