Custom Metrics
Metrics might not be properly saved in tables or they might be computed in the semantic layer of the BI tool. Yet, these metrics might be worth being monitored. For those reasons, you can use Sifflet's Metrics Custom template to define your own metric with a SQL query and plug Sifflet ML models on it.
The SQL query must return two columns:
- A time field
- A numerical field that you want to monitor
It is possible to return a third column on which a multi-dimensional monitor will be created. This column must be one of the dataset fields and cannot be renamed with an alias.
Example
I want to monitor my global revenue per day.
In the table called orders, there are the following fields:
ordered_at: timestamp of the orderorder_total: amount of the order without taxtax_paid: tax paid for the order
The revenue per order is the sum of order_total and tax_paid. To monitor the global revenue per day, the SQL query will need to aggregate that sum by day.
Here is the custom SQL query on Snowflake:
SELECT ordered_at::date, sum(order_total+tax_paid) FROM orders group by 1;
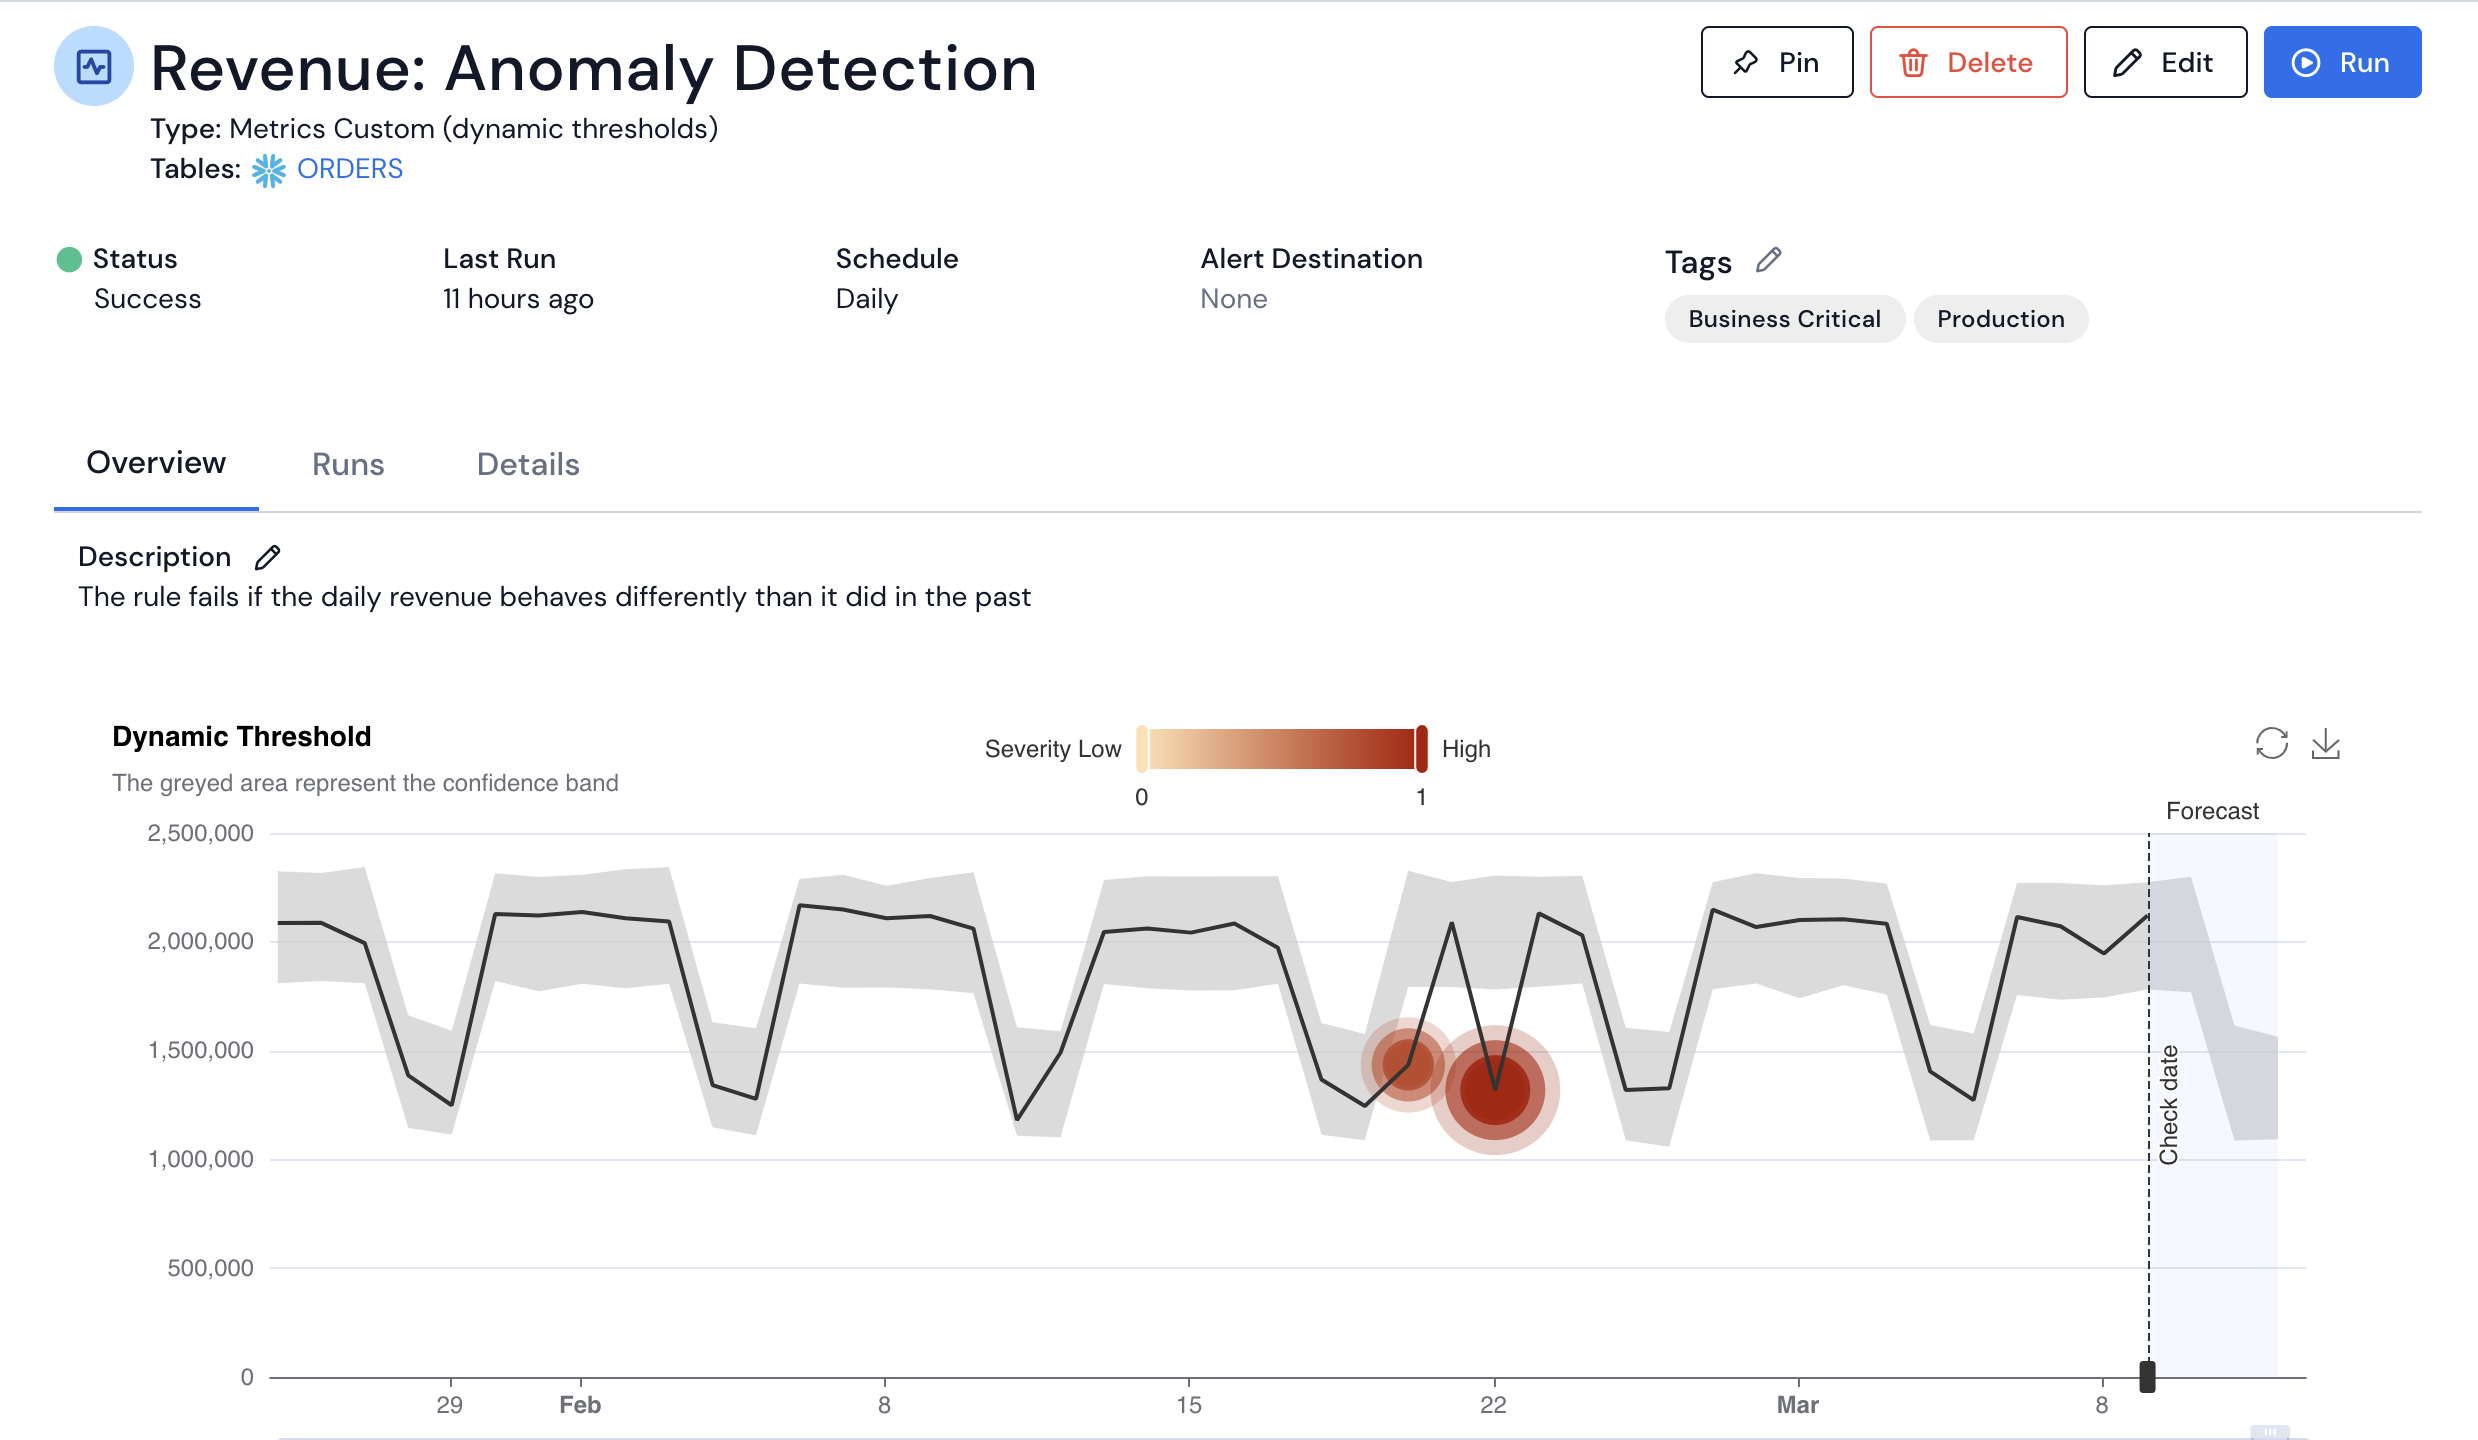
This will enable the detection of anomalies in the revenue like a drop in this example on the 22nd of February.
Updated about 1 month ago