Data Catalog
The Data Catalog is your data assets' source of truth. It allows you to:
- Find the asset you're looking for and thoroughly understand it thanks to business and technical context
- Identify unhealthy assets and troubleshoot detected data quality issues
- Quickly access assets you're in charge of
- See a breakdown of your assets across various dimensions (technologies, health, usage, owners, etc.) to optimise your costs by keeping a clean data fleet
Assets that show up on the Data Catalog page depend on the domain selected in the dropdown menu in the top right corner of the page.
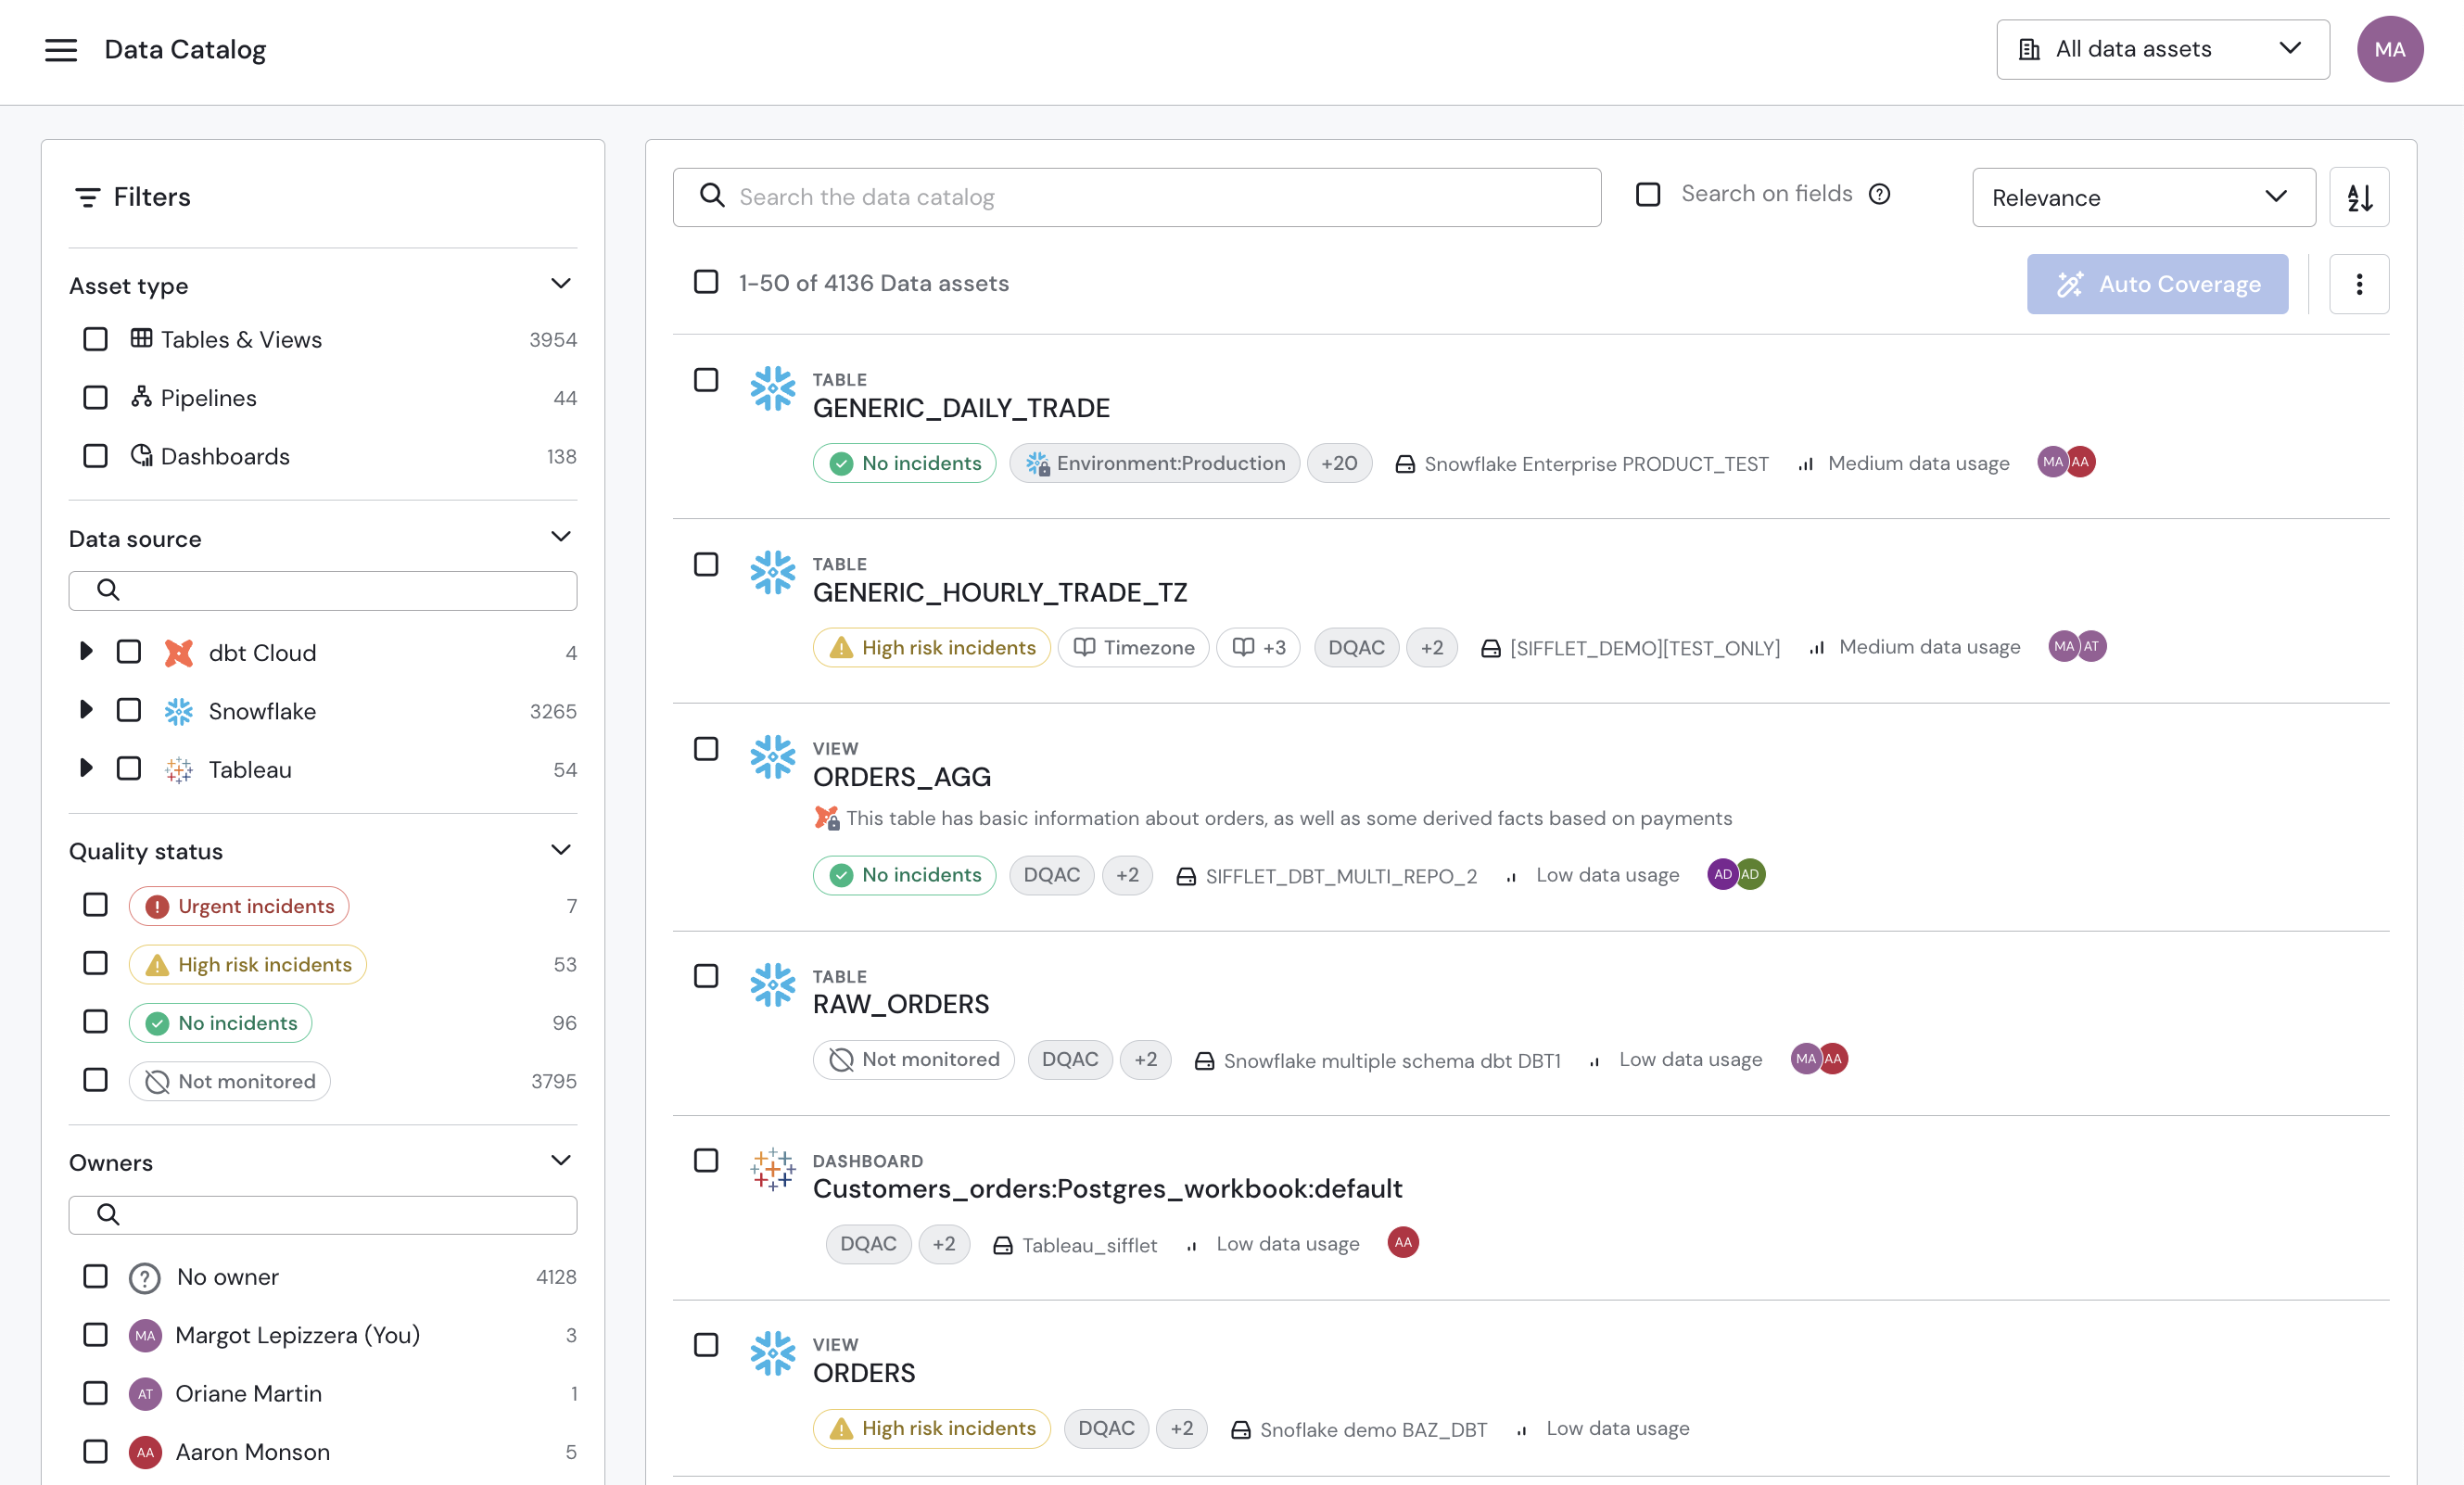
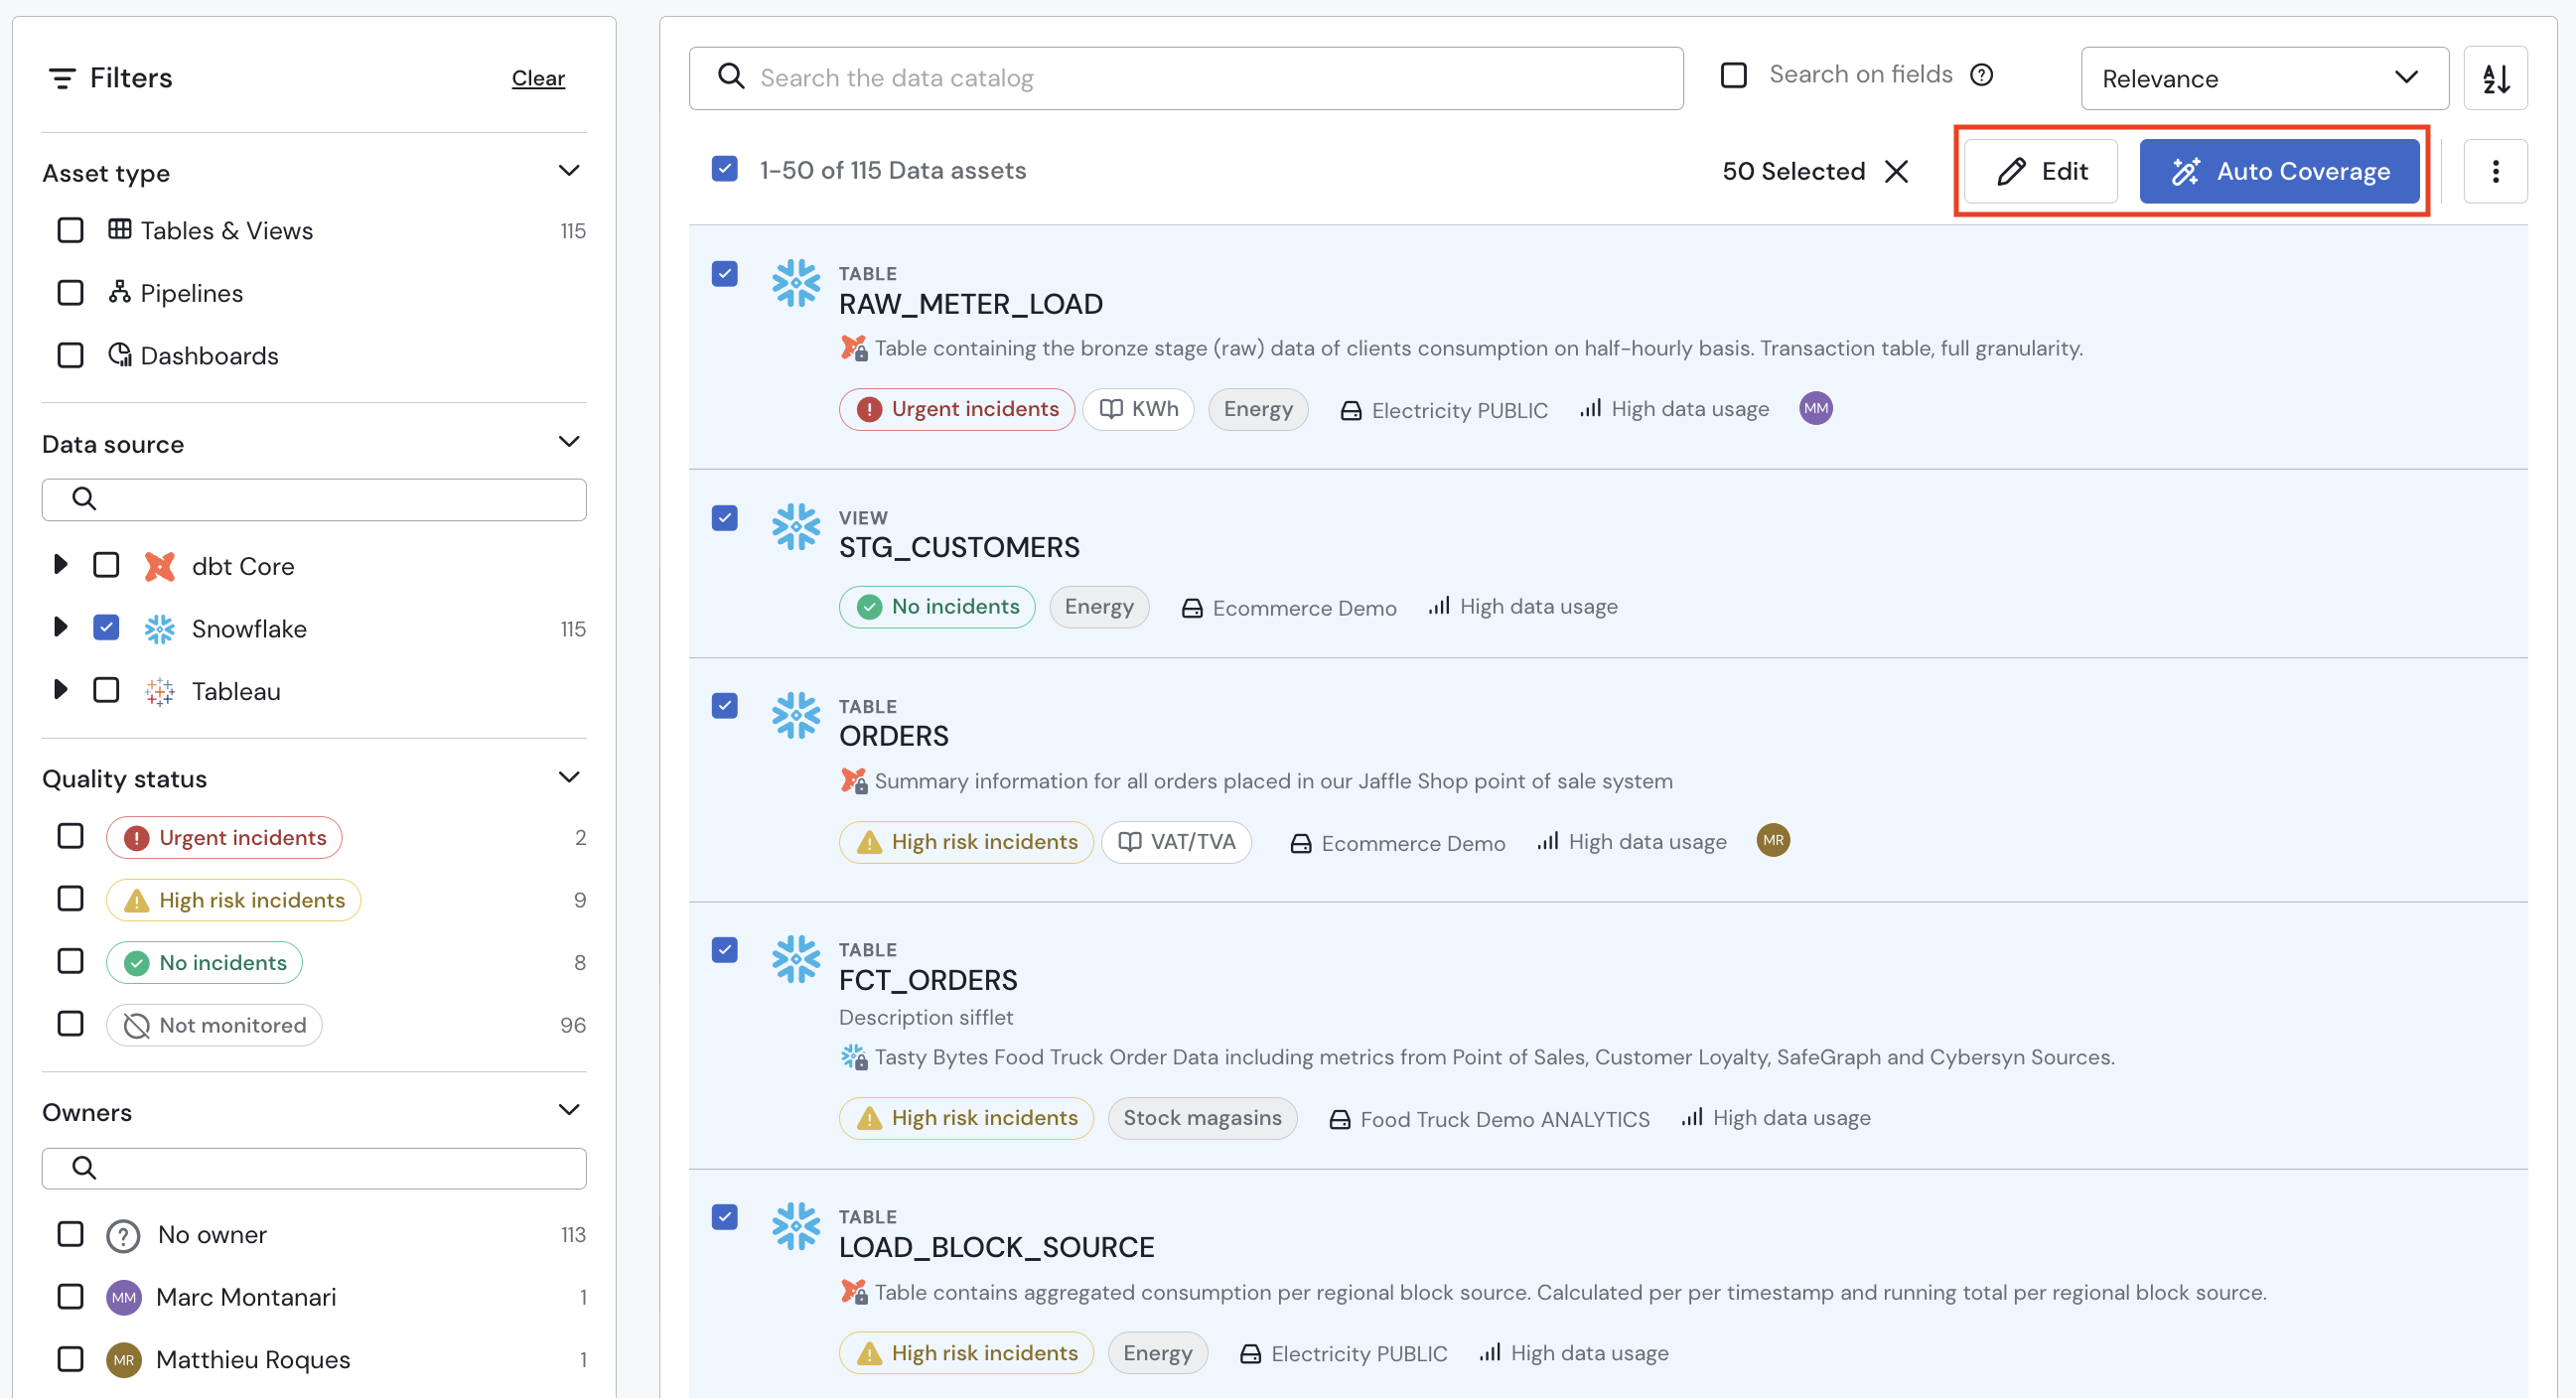
Asset list
The list shows all data assets that correspond to the applied search and filters. By default, there are 50 items per page - this number can be customised.
For each single asset, you can see your asset's:
- Technology
- Type
- Name
- Description, which can be automatically extracted from your data source and/or manually edited by your team on Sifflet
- Quality status
- Tags
- Data source name
- Data usage
- Owners

Clicking a specific asset redirects you to the dedicated Asset page.
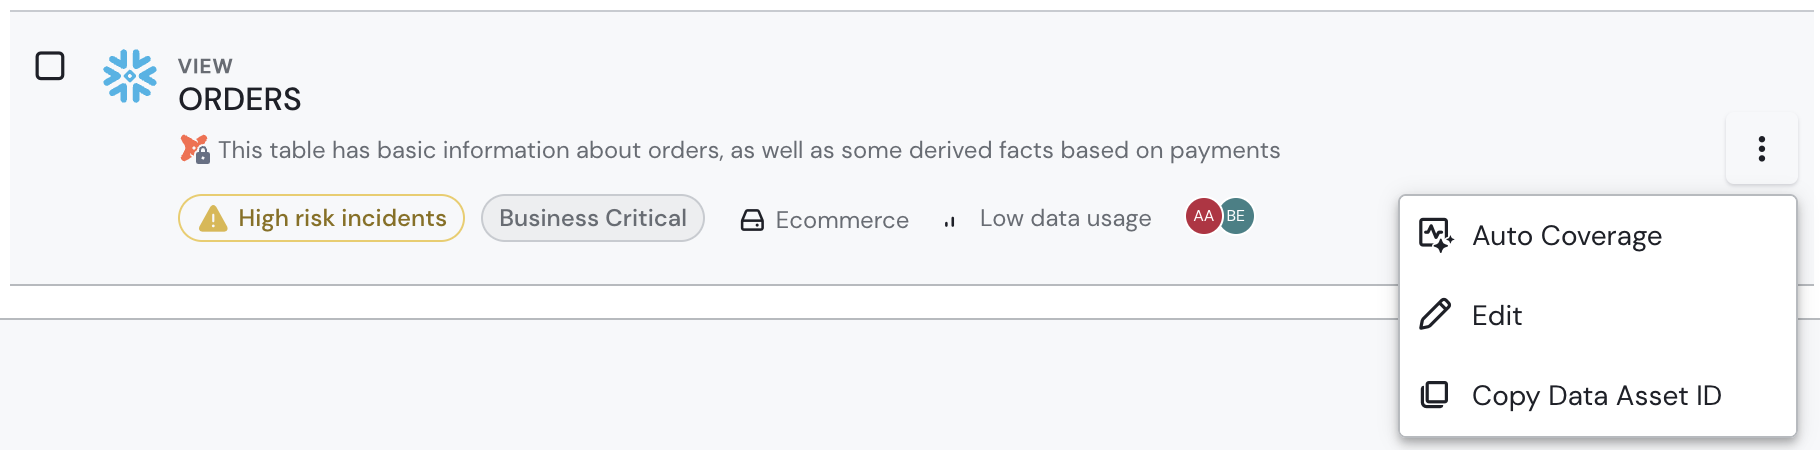
Quick actions
Hovering any asset on the list displays an overflow menu at the far right end of each asset row allowing you to:
- Apply auto coverage to the asset
- Edit the tags, business terms, description, and owners of the asset
- Copy the data asset ID
Search
By default, the search is performed on assets' name and description.
You can optionally tick the Search on fields checkbox to also have the search performed on field names and descriptions for Tables & Views assets.

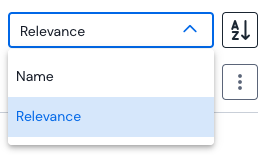
Sort
Assets can be sorted by:
- Relevance
- Name
For both, you can decide to sort assets in an ascending or descending order.
Filter
Filters can be added by ticking boxes and removed by unticking boxes or clicking the Clear at the top of the filter sidebar.
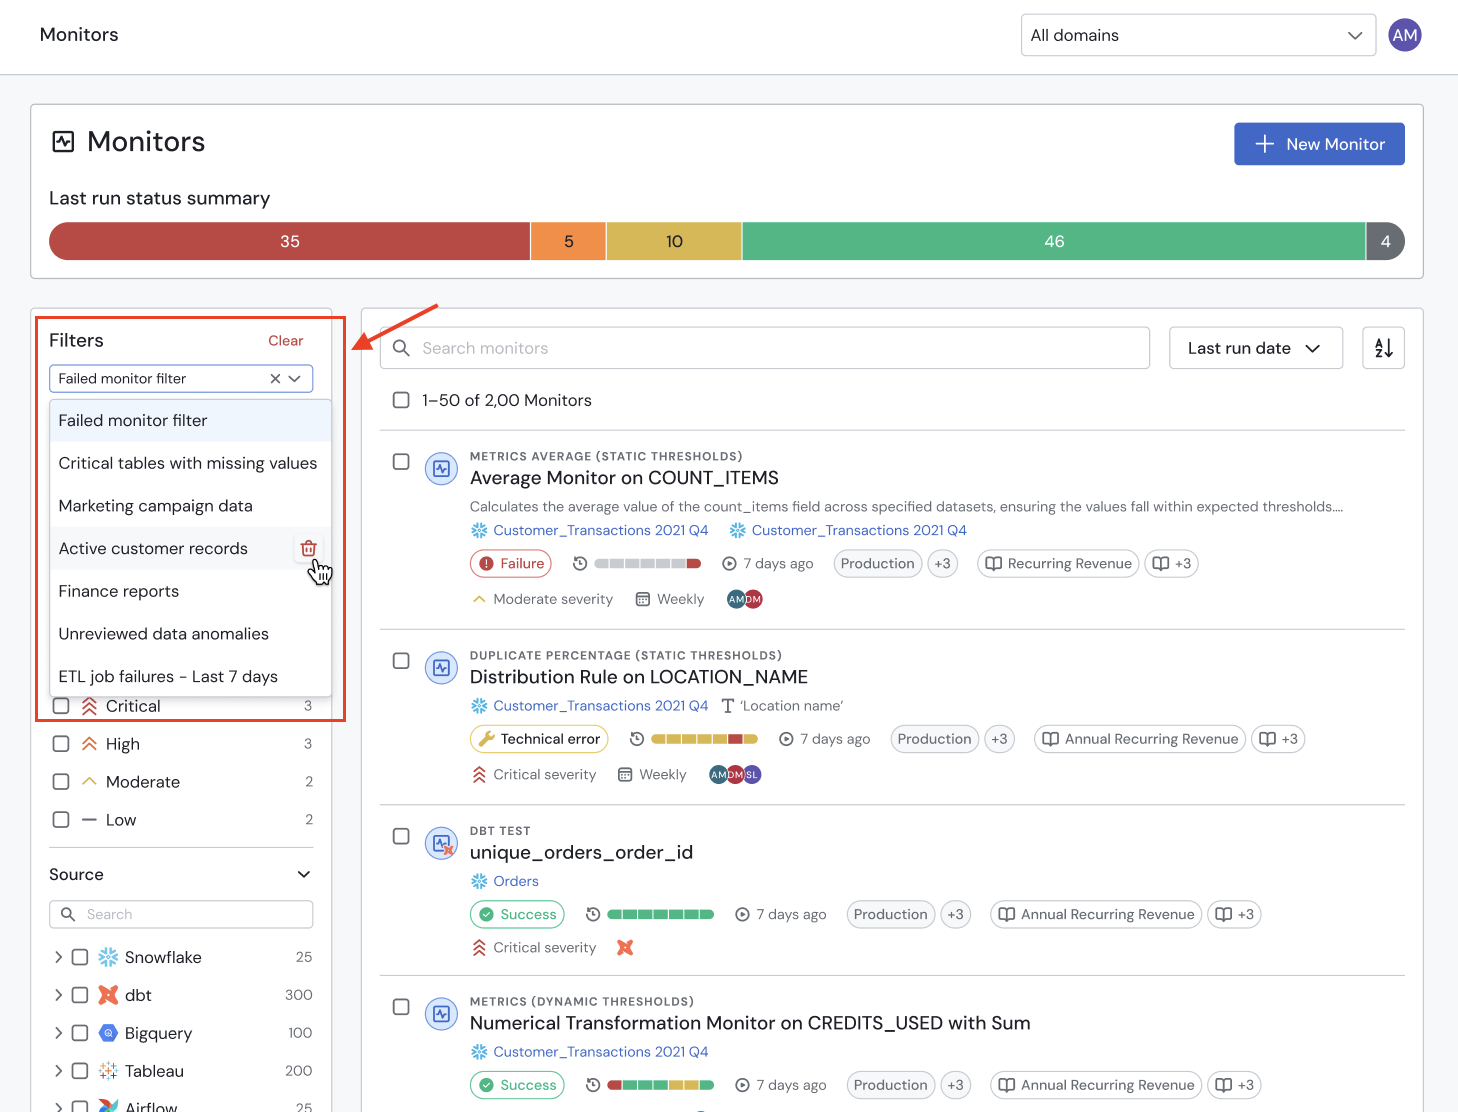
Saving and reusing filters
You can save and reuse your filter configurations to streamline your workflows and quickly access your most common data views. The process to create and use saved filters is the following:
- Apply any combination of filters on a supported page (Catalog, Monitors, or Incidents).
- Click the
Savebutton that appears once filters are applied. - Give your filter set a descriptive name.
- Reuse Instantly: Next time you visit the page, you can select your saved filter set from a list instead of manually configuring the filters again.
Saved filters are personal (for now)Saved filters are currently specific to your user account. We are exploring options to allow sharing saved filters with your team in a future update.
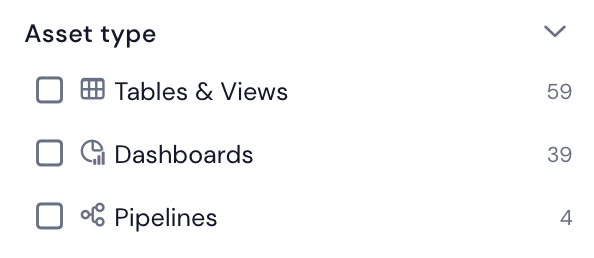
Asset type
Three types of data assets can populate the Data Catalog depending on the configured integrations:
- Tables & Views
- Dashboards
- Pipelines
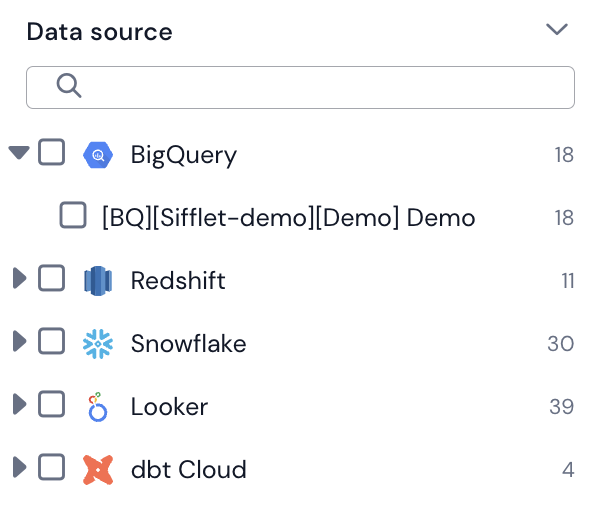
Data source
You can filter on some specific integration technologies or directly on your data source names.
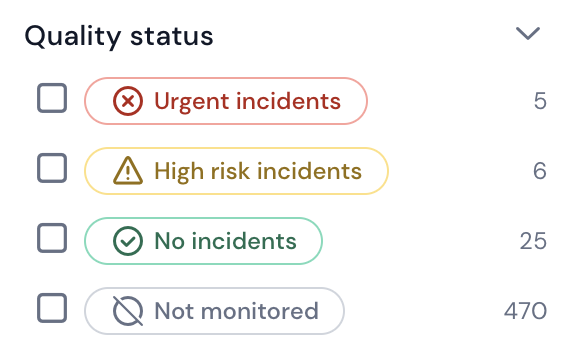
Quality status
Asset quality status is based on whether or not the asset is covered by monitors as well as on the severity of the incidents impacting the data asset:
- Urgent incidents: asset has at least one configured monitor & asset has at least one ongoing incident with a
Criticalseverity. - High risk incidents: asset has at least one configured monitor & asset has at least one ongoing incident with a
Low,Moderate, orHighseverity. - No incidents: asset has at least one configured monitor & does not have any ongoing incident.
- Not monitored: asset does not have any configured monitor.
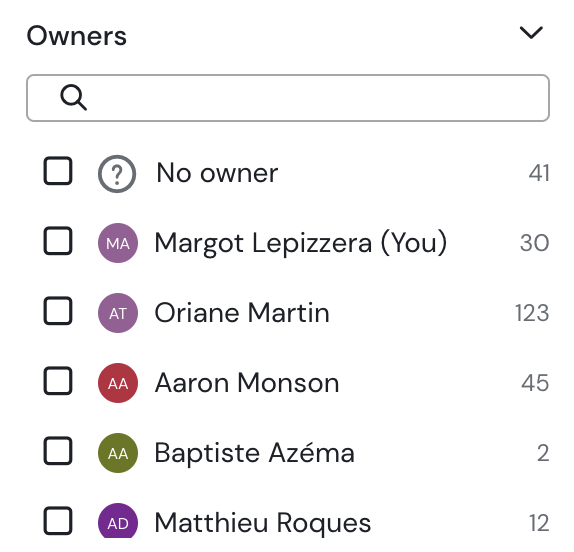
Owners
You can filter on the owners assigned to your assets.
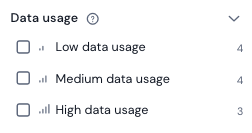
Data usage
You can read more about asset data usage here.
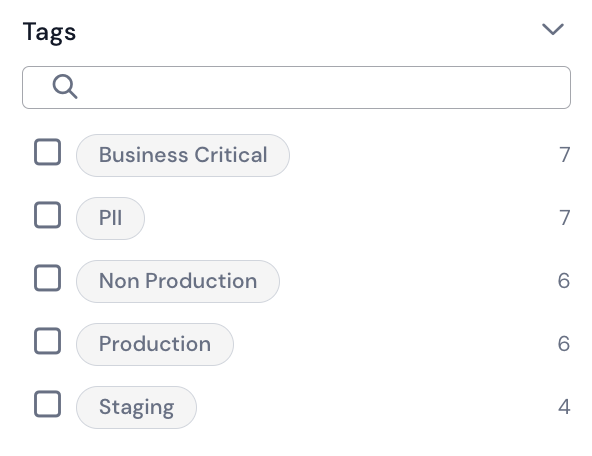
Tags
Assets can be filtered using any of the tags they are associated with. Tags can be set up in the Settings.
Bulk Actions
You can perform bulk actions on your assets:
- Select one, several or all assets from your search results either by ticking assets' individual checkboxes or by leveraging the checkbox at the top of your Data Catalog.
- You can then perform two different types of bulk actions on your assets:
- Click the
Editbutton to edit selected assets' tags, business terms, description, owners.
When multiple assets are selected:- Ticking the
Remove existing tags/terms/ownerscheckbox completely empties any tags/terms/owners that might exist on the selected assets. - Adding a description entirely replaces the content of selected assets' description and replaces it with the new one.
- Ticking the
- Click the
Auto Coveragebutton to bulk create monitors on top of selected assets.
- Click the
Data Catalog API
With our public Data Catalog API, users can push data from their internal or third-party data catalog tools directly into Sifflet.
This allows users to enrich their assets with richer metadata directly in Sifflet, enabling more robust monitoring. With this API, users can:
- Import metadata from their data catalog into Sifflet
- View data catalog metadata directly on asset pages
- Open assets directly in the data catalog from Sifflet
For more information, check our API documentation.
Updated 10 days ago