

Get Started
Goal: In about an hour, go from an empty account to your first real data incident—identified, investigated, and resolved.
You need: A Sifflet account with the Admin role, a data warehouse or data platform (Snowflake, BigQuery, Fivetran, etc.), and optionally, a BI tool (Looker, Tableau, or Power BI).
What You'll Learn
- Connect a data source
- Create teams and assign owners to assets
- Create domains
- Create monitors on your tables
- Set up collaboration tools and notifications (email, Slack, or Teams)
- Handle incidents
Example used on this page: a company's Operations team needs to trust its delivery data. Its tables live in Snowflake (PROD_DB.OPERATIONS.SHIPMENTS and PROD_DB.OPERATIONS.INVENTORY), and it uses a Looker dashboard called Daily Deliveries.
1. Connect a Data Source
-
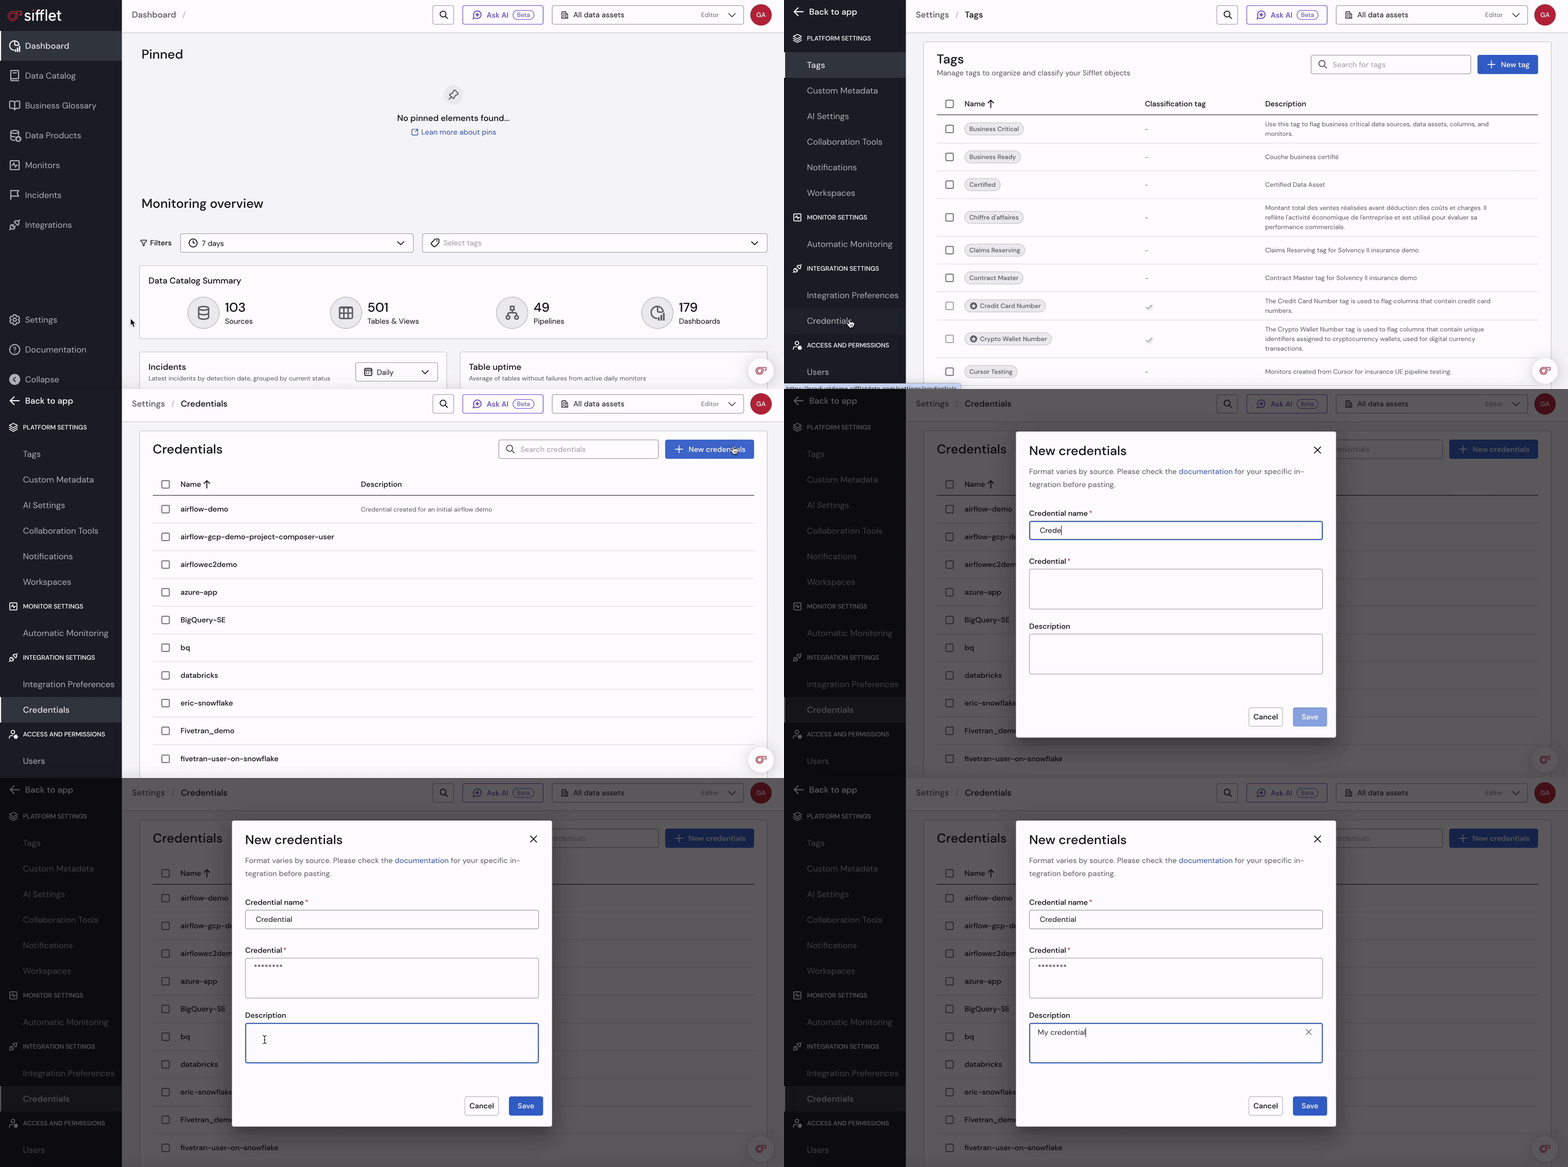
Create a service account for Sifflet in your warehouse (supported technologies).
-
Add the credentials in Sifflet.
-
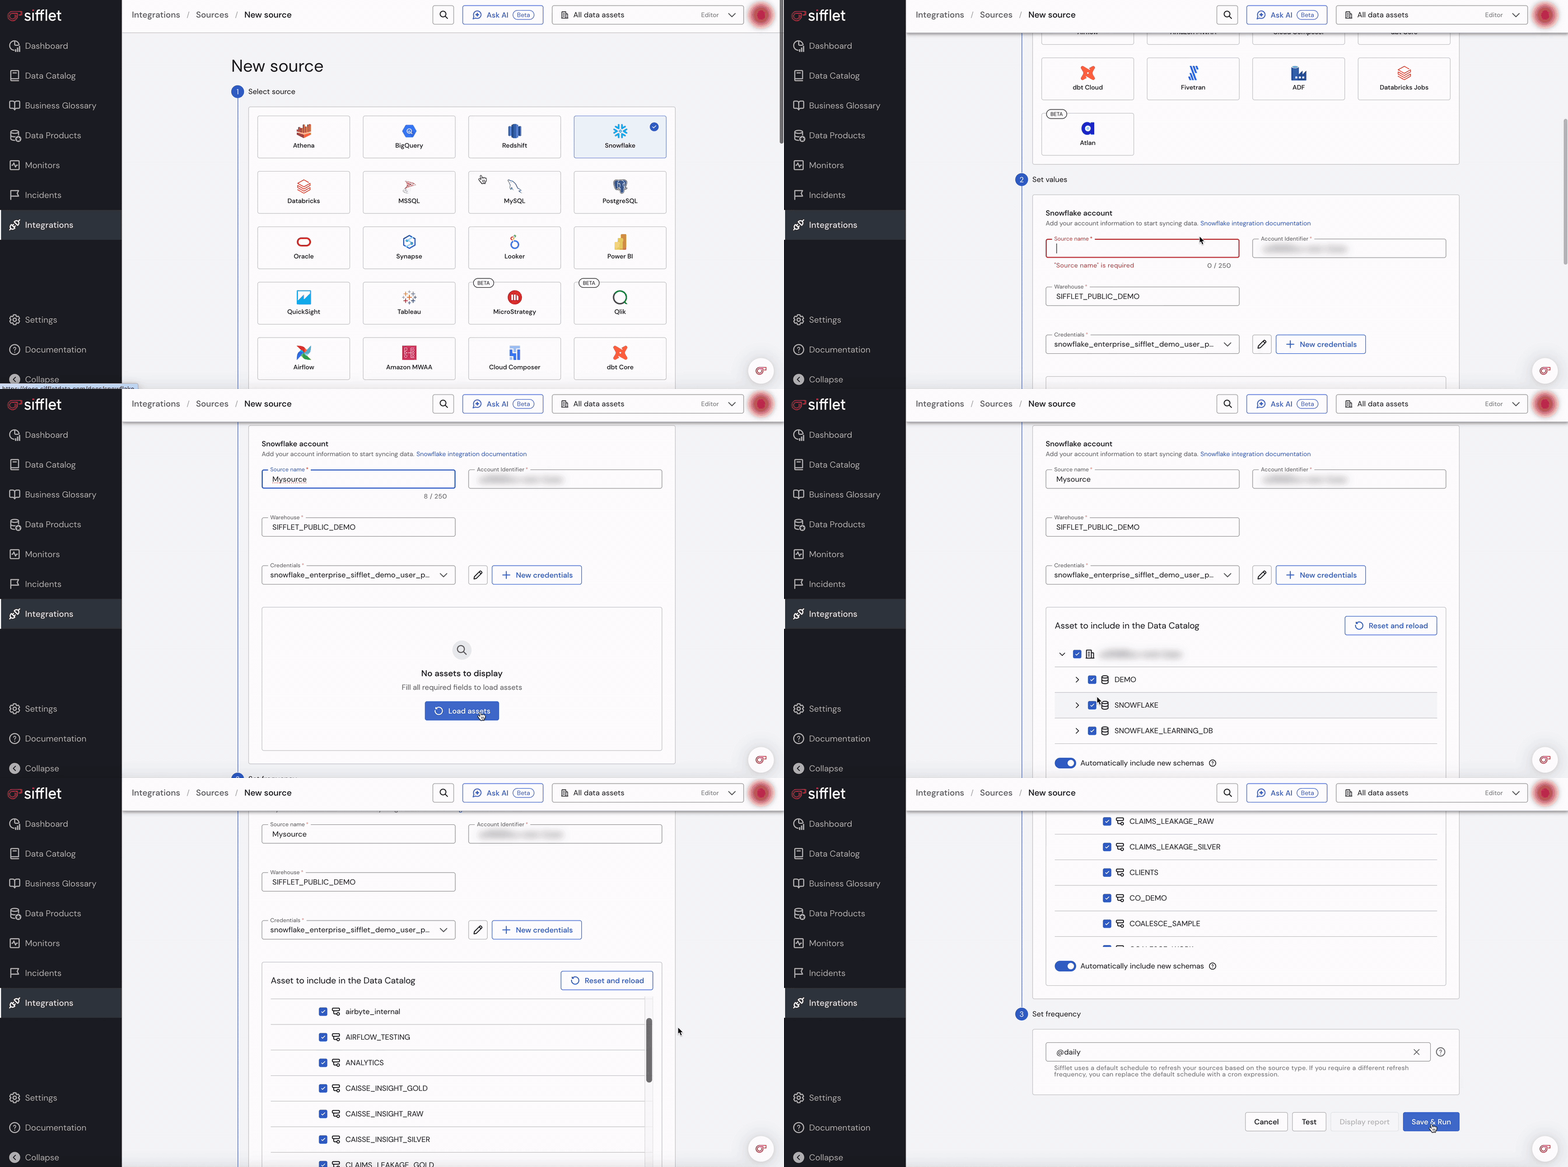
Add the source: pick the credential, then choose the databases and schemas to include.
-
Let the catalog sync.
2. Create Teams and Assign Owners (Optional)
Why: teams make it clear who is responsible for each piece of data. When something breaks, the incident goes straight to the right people.
- Add users. Settings → Users → Add user. Invite everyone who will use Sifflet.
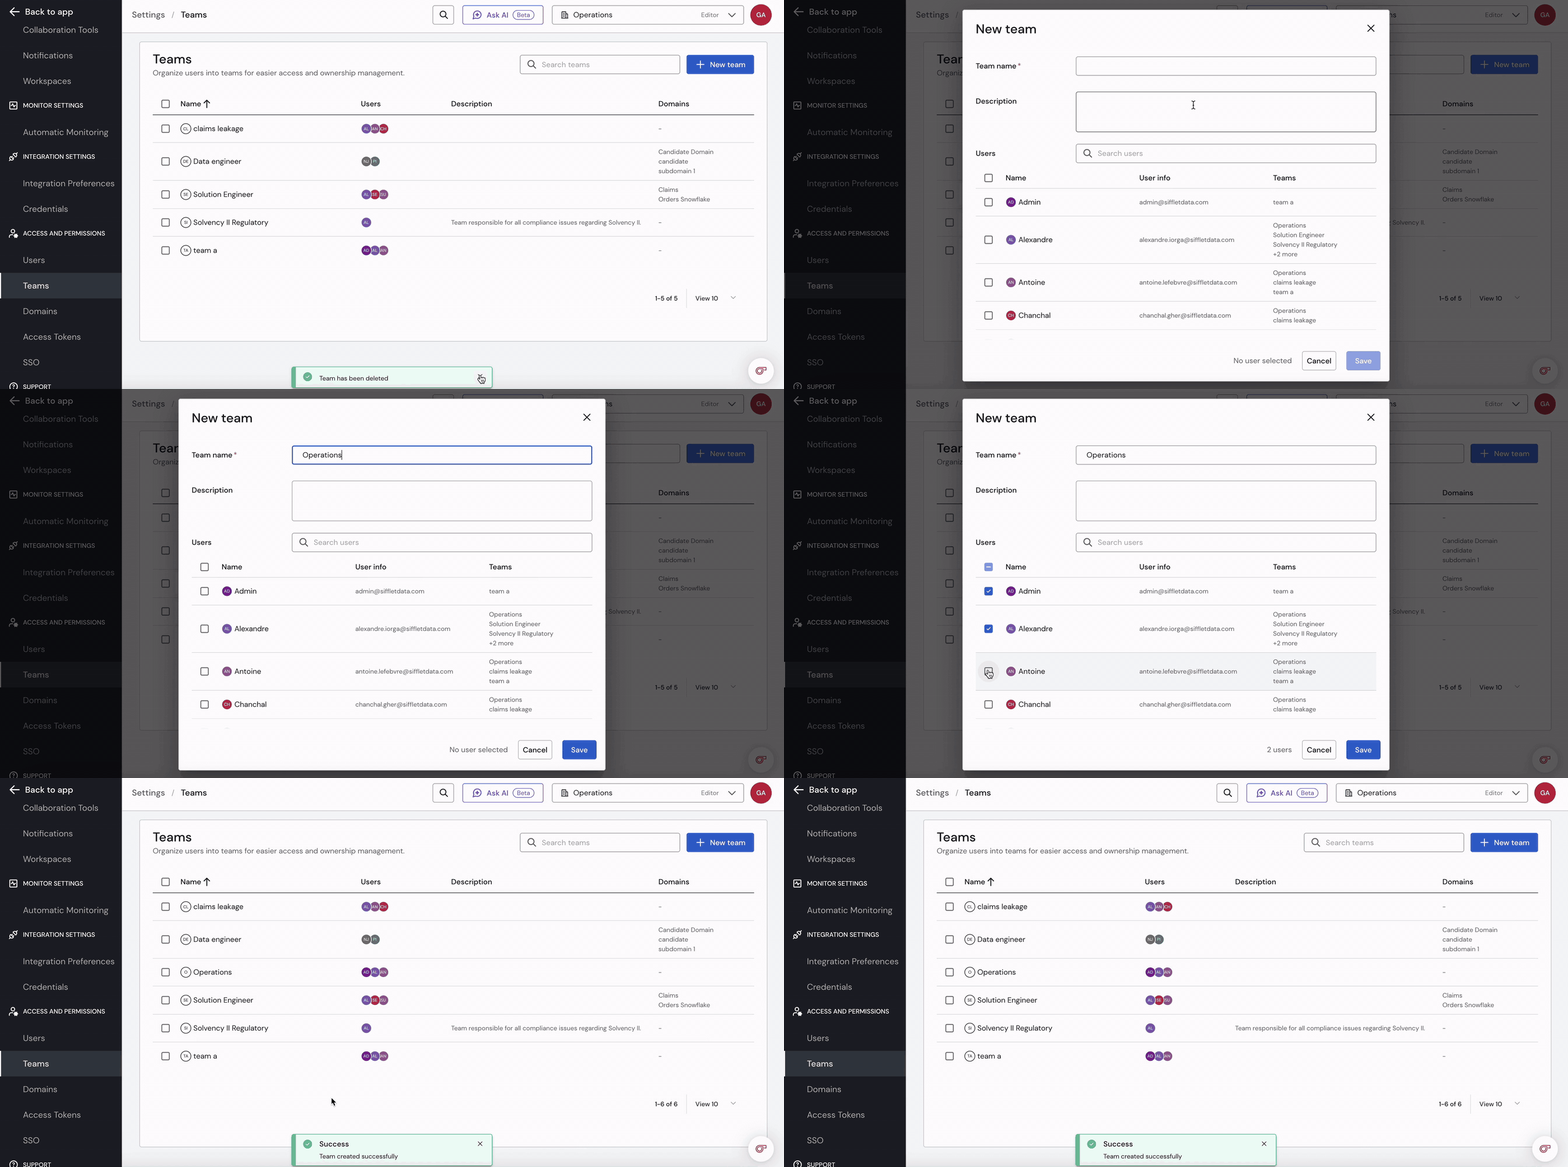
- Create one team per area. Settings → Teams → Create Team. Give it a name and add members.
- Turn on Teams as a custom metadata field. Without this, you can't pick a team as an owner.
- Set a team as owner. On each asset or monitor, choose its owning team.
Example
- Team: Operations, members: Marie (Ops data lead) and Karim (data engineer)
- Team: Data Platform, the central data team
- Owner of
SHIPMENTS,INVENTORYand Daily Deliveries: Operations
3. Create Domains (Optional)
Why: a domain groups the assets that belong to one business area. Each team then sees only its own data, and incidents and alerts stay focused on that area. Domains also protect sensitive data, like Finance or HR.
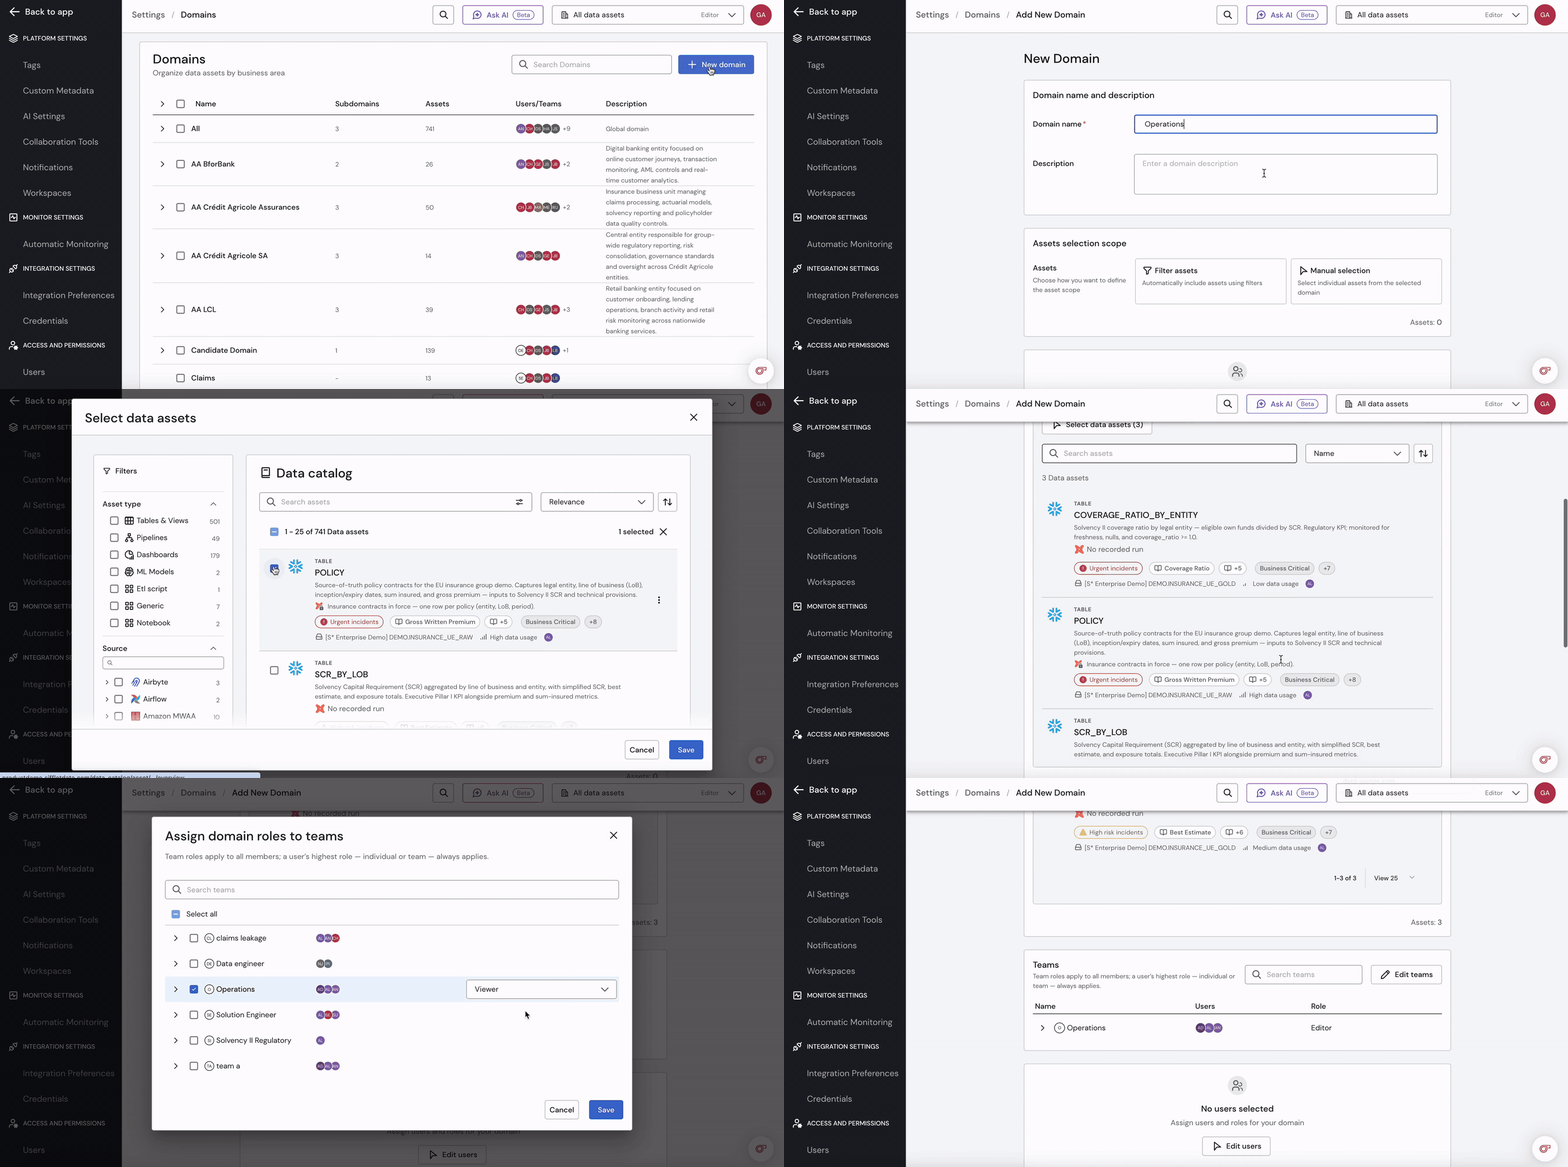
- Create the domain. Settings → Access and Permissions → Domains → + New domain. Give it a name. Only an Admin can do this.
- Add assets
- Give teams access with a role: Viewer (can see) or Editor (can change monitors and incidents).
Example
- Domain: Operations, filled dynamically with every asset tagged
operations
- Subdomain Logistics:
SHIPMENTSand the Daily Deliveries dashboard- Subdomain Inventory:
INVENTORY- Access: Operations team as Editor, Data Platform as Viewer
✅ Someone from Finance, who isn't in the domain, can't see the Operations tables.
4. Create Monitors
Why: monitors check your data automatically, like whether it arrived on time, whether values are missing or whether a column changed. When one fails, Sifflet opens an incident and alerts the owning team, so you catch issues before they reach dashboards and users.
- Open the monitor builder. Monitors → New monitor, or from a table's page. You can also use Sentinel, which suggests monitors for you.
- Choose the table, and the column if needed.
- Pick a monitor type
- Set severity and schedule. Severity is Critical, High, Moderate or Low; the schedule is how often the monitor runs.
- Set owner and tags. The owner is the team you created in section 2. Notification rules (section 5) then send the alerts to the right channel.
- Save. Dynamic monitors need a few days of history to learn what's normal.
Example: monitors on
SHIPMENTS
Monitor Setting Severity Freshness on UPDATED_AT, expected every hourCritical Volume (dynamic) daily row count High Nulls WAREHOUSE_IDHigh
5. Set Up Collaboration Tools and Notifications
Why: Sifflet sends alerts and incidents to the tools your team already uses (Slack, Teams, email, Jira), so nobody has to keep checking Sifflet. Notification rules make sure each alert reaches the right team.
- Open the settings. Settings → Collaboration Tools.
- Connect your tool: Slack, Microsoft Teams, email, etc.
- Create notification rules: choose which alerts (domain, severity, monitor type) and where they go (a channel or email).
- Test it. Send a test alert.
Example
- Connect Slack, then create the channel #ops-data-alerts
- All Operations monitors send to
#ops-data-alerts- Critical monitors also email
[email protected]
✅ The Operations team receives a test alert in Slack.
6. Handle Incidents
Why: an incident brings together everything about one data problem: the failing monitors, the affected tables and dashboards, and who's working on it. The team fixes it faster, business users know what's impacted, and every fix is recorded for next time.
- Triage: open the incident and look at the failing monitors and their severity.
- Assign: click Edit, choose an owner or team, and move the status to In Progress.
- Investigate and fix: the Lineage tab shows the root cause upstream, and Impacted Dashboards shows who's affected. Fix the issue, then add a comment in the Activity Feed.
- Resolve: close as Closed — Fixed, Closed — No Action Needed or Closed — False Positive / Expected.
Updated 12 days ago