Dashboard
Overview
The Dashboard page gives you a bird's-eye view of all activities on your Sifflet account.
- It allows you to quickly access all the Sifflet objects (data assets, monitors, incidents) that matter the most to you.
- It provides insights about your monitoring and catalog coverage.
- It helps you assess current and past health of your data pipelines by surfacing appropriate monitors and incidents information.
- It helps you optimise your monitoring accuracy through custom monitor configuration recommendations.
Dashboard filters
Tags
The Dashboard filter section of the Dashboard allows you to filter on the content of your Dashboard through tags, making it easy for you to tailor this bird's-eye view of your Sifflet account to specific data products, teams, etc.
By default, no tag is applied to your dashboard and the entire content of your dashboard is solely based on the domain you might have selected with the ever-present Domains dropdown located at the very top of your page.
You can apply one or multiple tags to filter your dashboard content on. When a tag is selected, the content of the following sections is filtered:
Incidents: incidents filtering is based on the tags of the monitors that triggered the incident. Note: Filtering uses tags the monitor is associated to at filtering time, and not tags the monitor was associated to at incident creation time for instance.Sifflet AI Assistant - MonitorsMonitorsIntegration Sources: filtering is based on the tags of the data source itself as well as on the objects collected by data sources.
Apply Tag Filtering to Your Dashboard
Multiple Tags Filtering
Selecting multiple tags in the dashboard filter shows you all objects that are tagged with at least one of those tags (i.e. an OR operator is used under the hood). Example: If you select Environment: Production and Environment: Staging, your dashboard will show all objects tagged either with Environment: Production or with Environment: Staging, or with both Environment: Production and Environment: Staging.
Date range
By default, the dashboard shows data for the last 7 days. You can use the date range filter to instead show data for the last 14, 30, or 90 days.
Pinned
The Pinned section of the Dashboard contains all the Sifflet objects you decided to pin when navigating the Sifflet application. This bookmarking mechanism allows you to save time by quickly accessing objects you regularly need directly on your Sifflet homepage, without having to search for them.
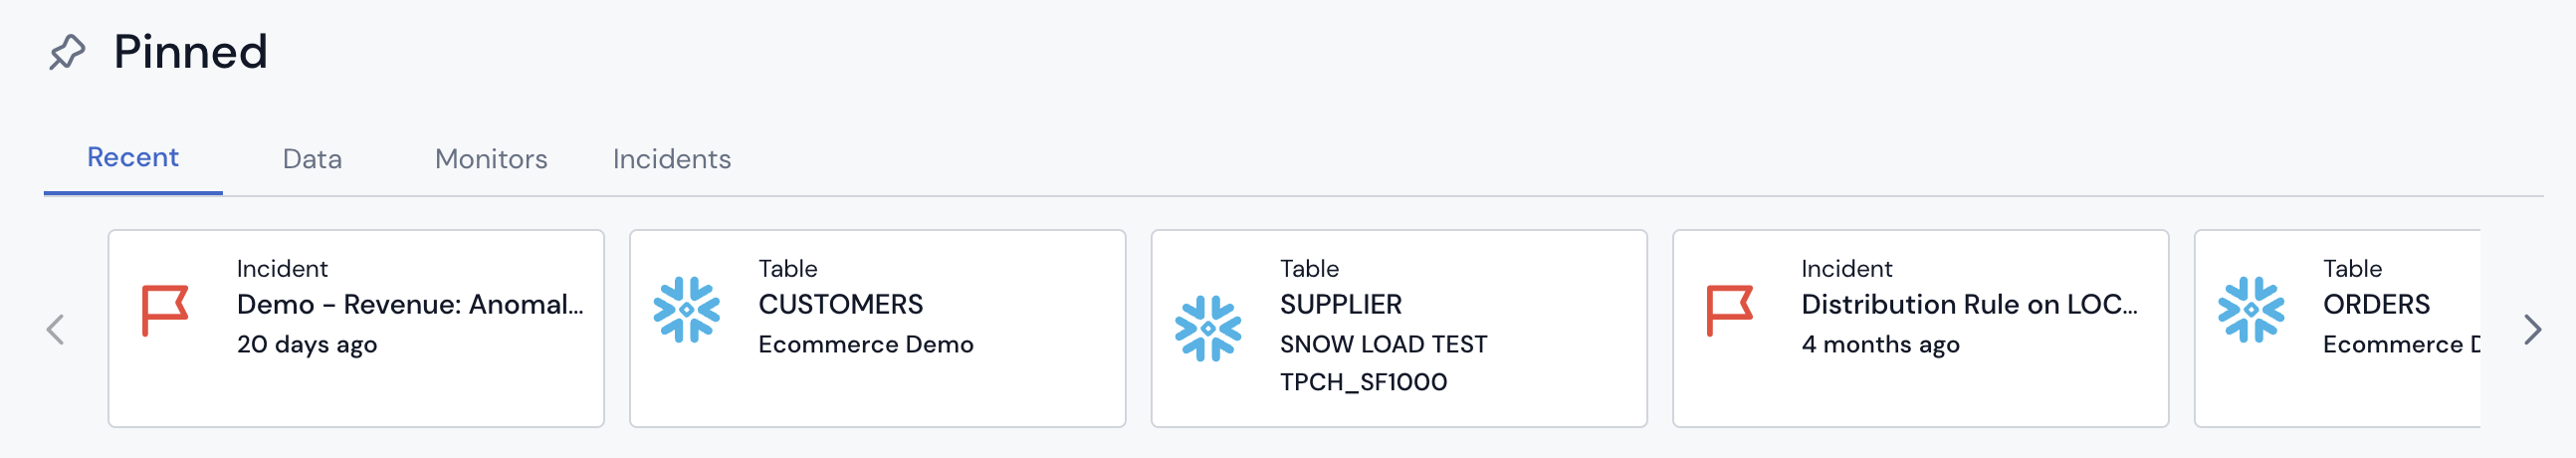
Dashboard "Pinned" Section
Objects are pinned on a per user basis, which means that objects you pin will only be pinned for you and not for other members of your Sifflet account.
Recent
The Recent tab shows all your pinned objects, regardless of their object type.
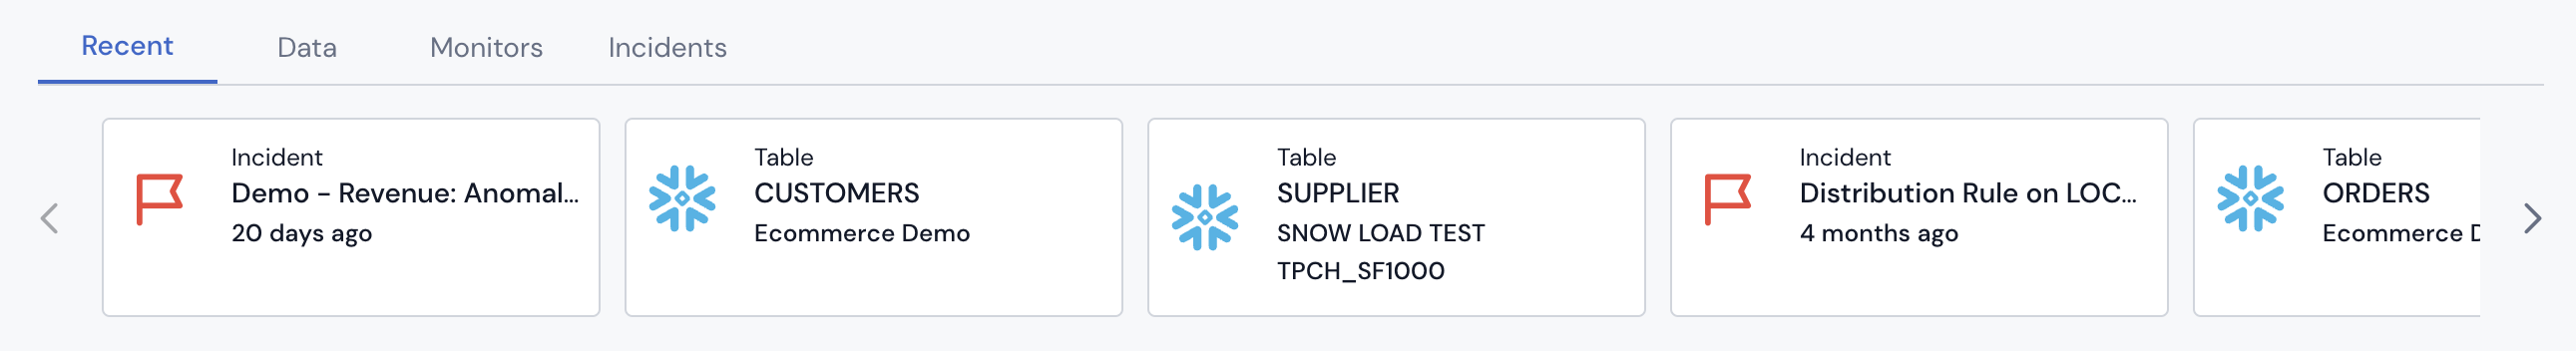
Dashboard "Pinned" Section - "Recent" Tab
Data
The Data tab shows all your pinned data assets.
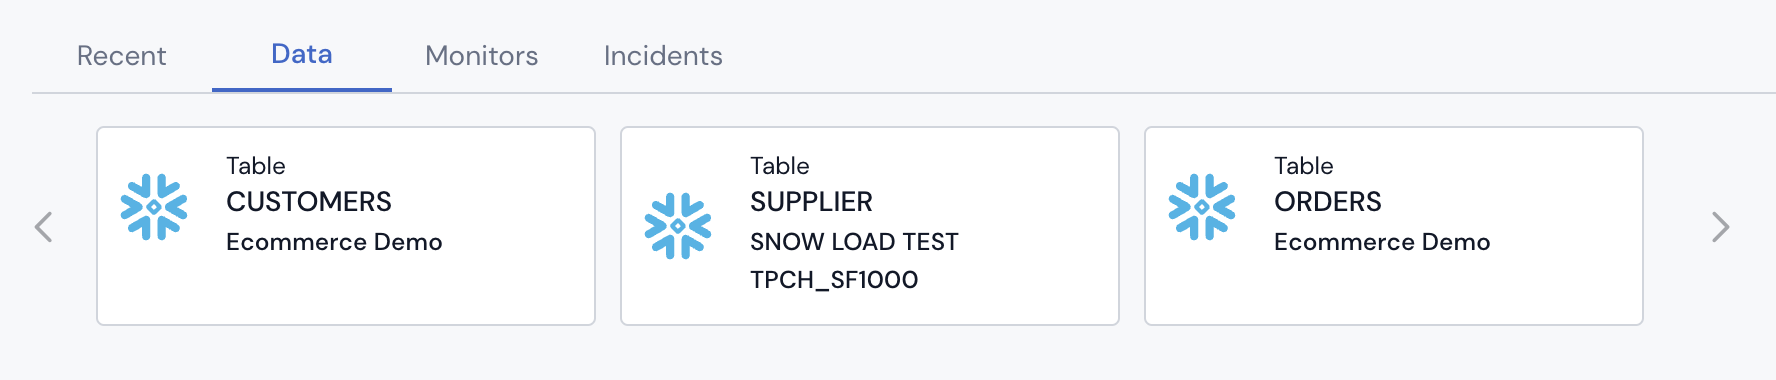
Dashboard "Pinned" Section - "Data" Tab
Monitors
The Monitors tab shows all your pinned monitors.
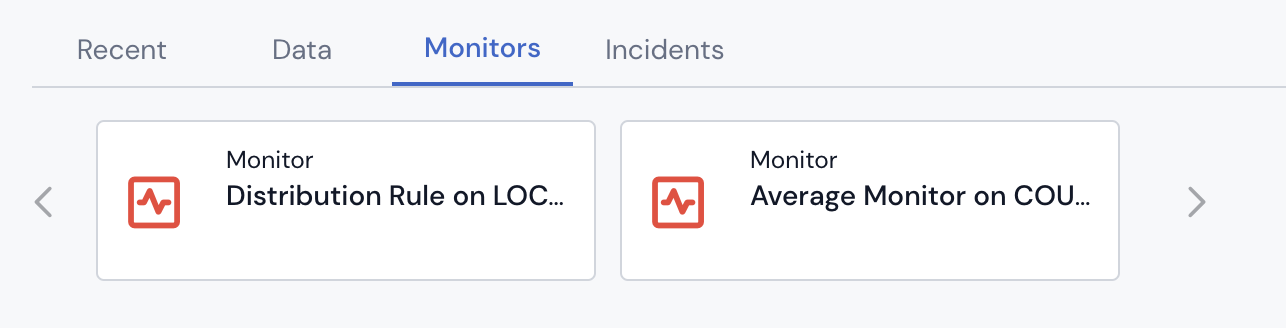
Dashboard "Pinned" Section - "Monitors" Tab
Incidents
The Incidents tab shows all your pinned incidents.
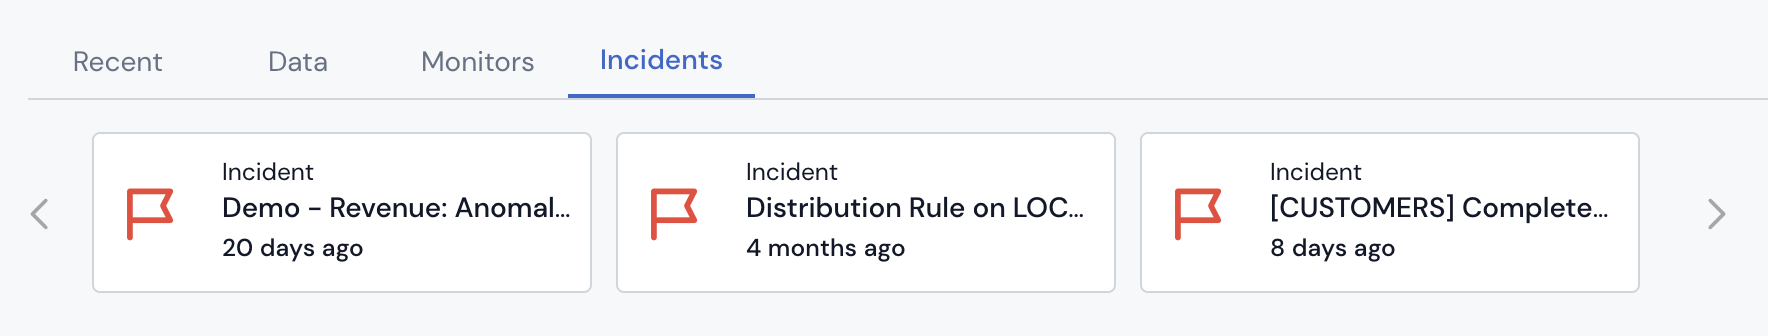
Dashboard "Pinned" Section - "Incidents" Tab
Pin/Unpin an Object
To pin/unpin an object from the Dashboard, you can either go to the object page and click the Pin/Unpin button. The following objects can be pinned:
- Asset
- Monitor
- Incident
Incidents Chart
The Incidents chart provides an overview of recent incidents created in the dates corresponding to the date range filter, grouped by incident status. Via the chart's own filter, you can switch between a daily and a weekly view.
By clicking on one of the bars, you'll be redirected to the Incidents page with the right filters pre-applied.
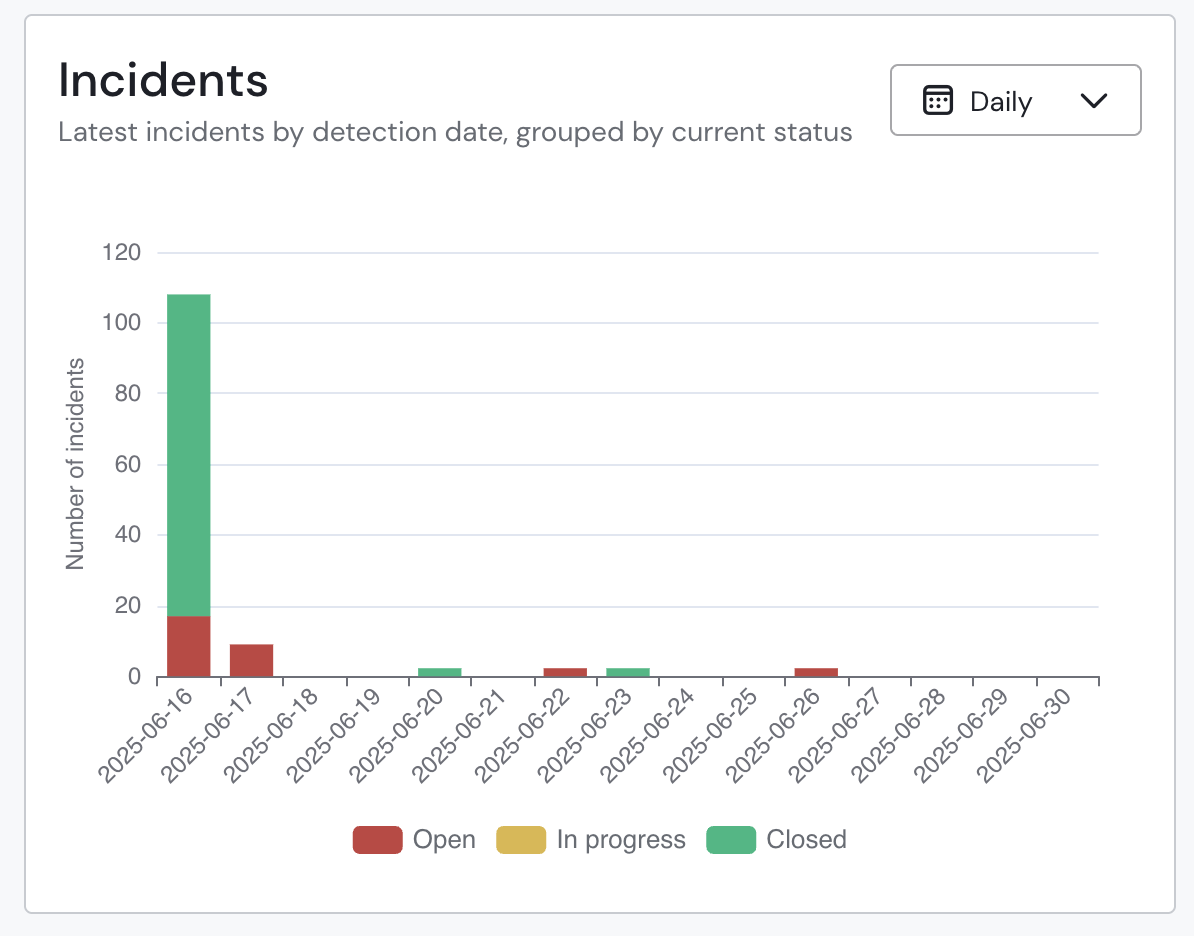
The Recent Incidents chart
Table Uptime Chart
The table uptime chart provides the percentage and number of tables without monitor failures over the selected period, as specified by the date range filter.
Three health metrics are calculated for every table (when applicable):
- Volume monitors
- Freshness monitors
- All monitors
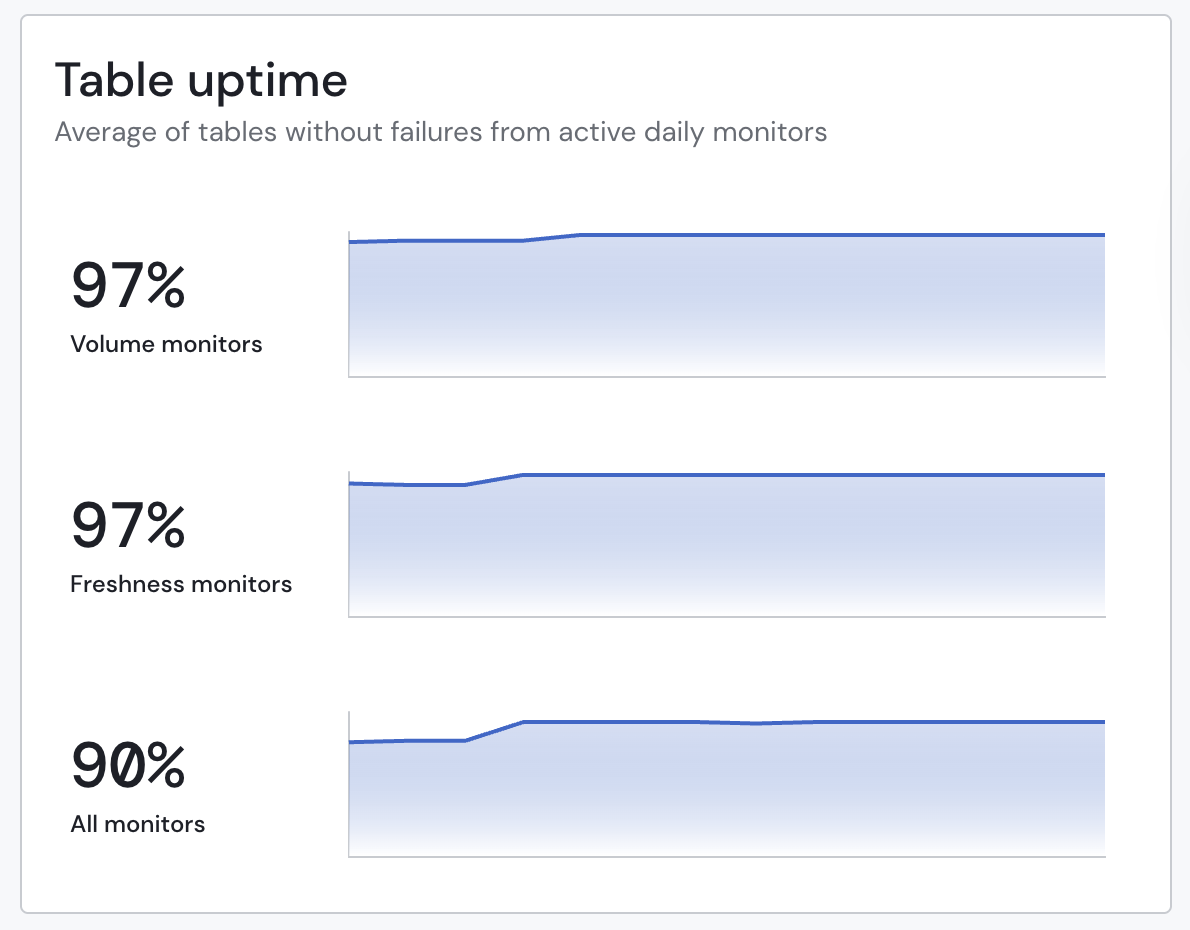
Table uptime chart
Excluded monitorsMonitors that run less frequently than once per day (every other day for example) are excluded from this chart for now.
Monitor Coverage Chart
The monitor coverage chart showcases the percentage (and number) of assets within your stack that have:
- At least one Sifflet monitor
- At least one external monitor (like dbt tests)
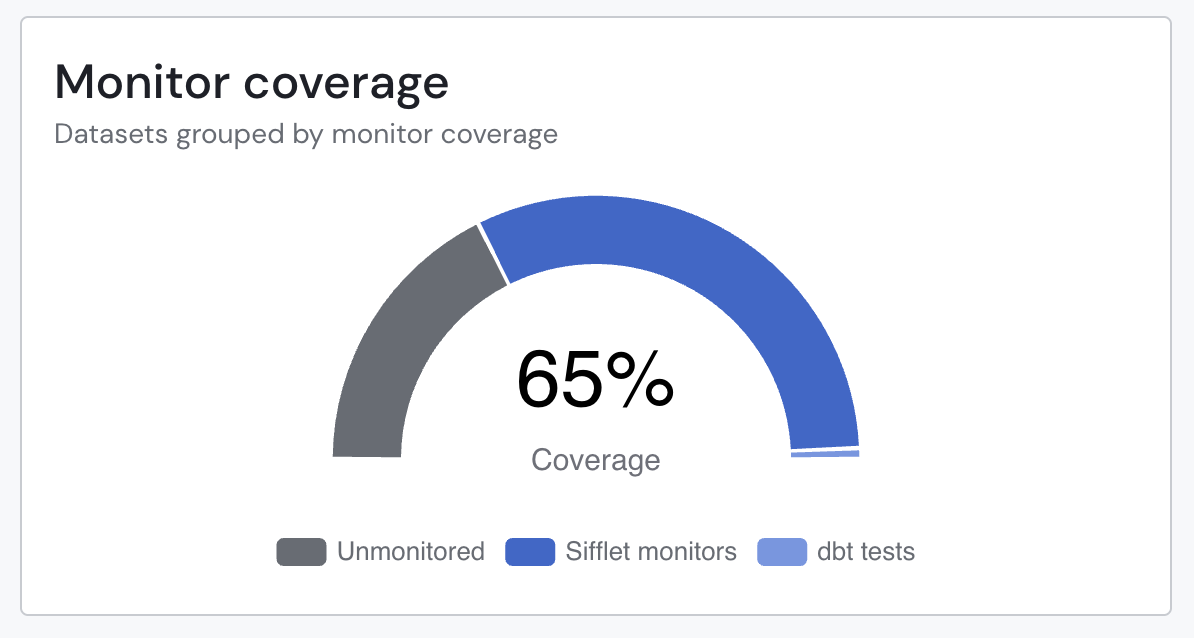
The monitor coverage chart
Assets that have both Sifflet monitors and external monitorsAssets that have Sifflet-native monitors and external monitors will show up as part of the "Assets with Sifflet monitors" group.
Monitor Types Chart
The monitor types chart showcases a breakdown of monitor types applied across your whole data stack. More details about monitor types are available on the templates library page.
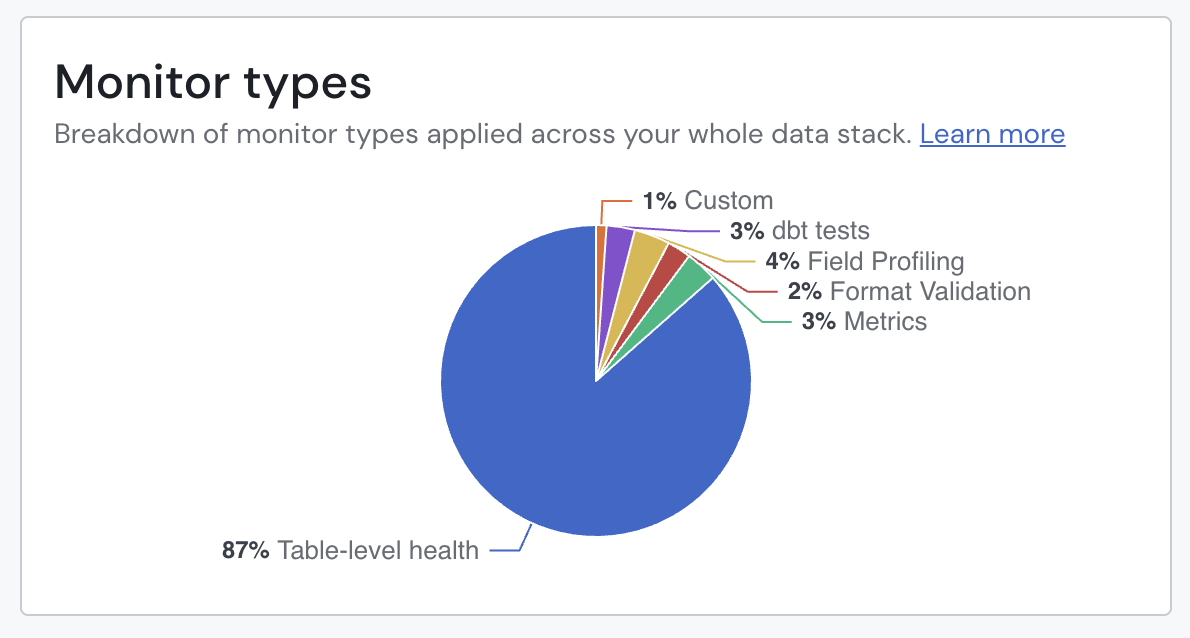
Monitor types chart
Sifflet AI Assistant - Monitors
The Sifflet AI Assistant - Monitors section of the Dashboard features all the monitor configuration changes recommended by the Sifflet AI Assistant to help you optimize your data quality monitoring. You can read more about those suggestions here.
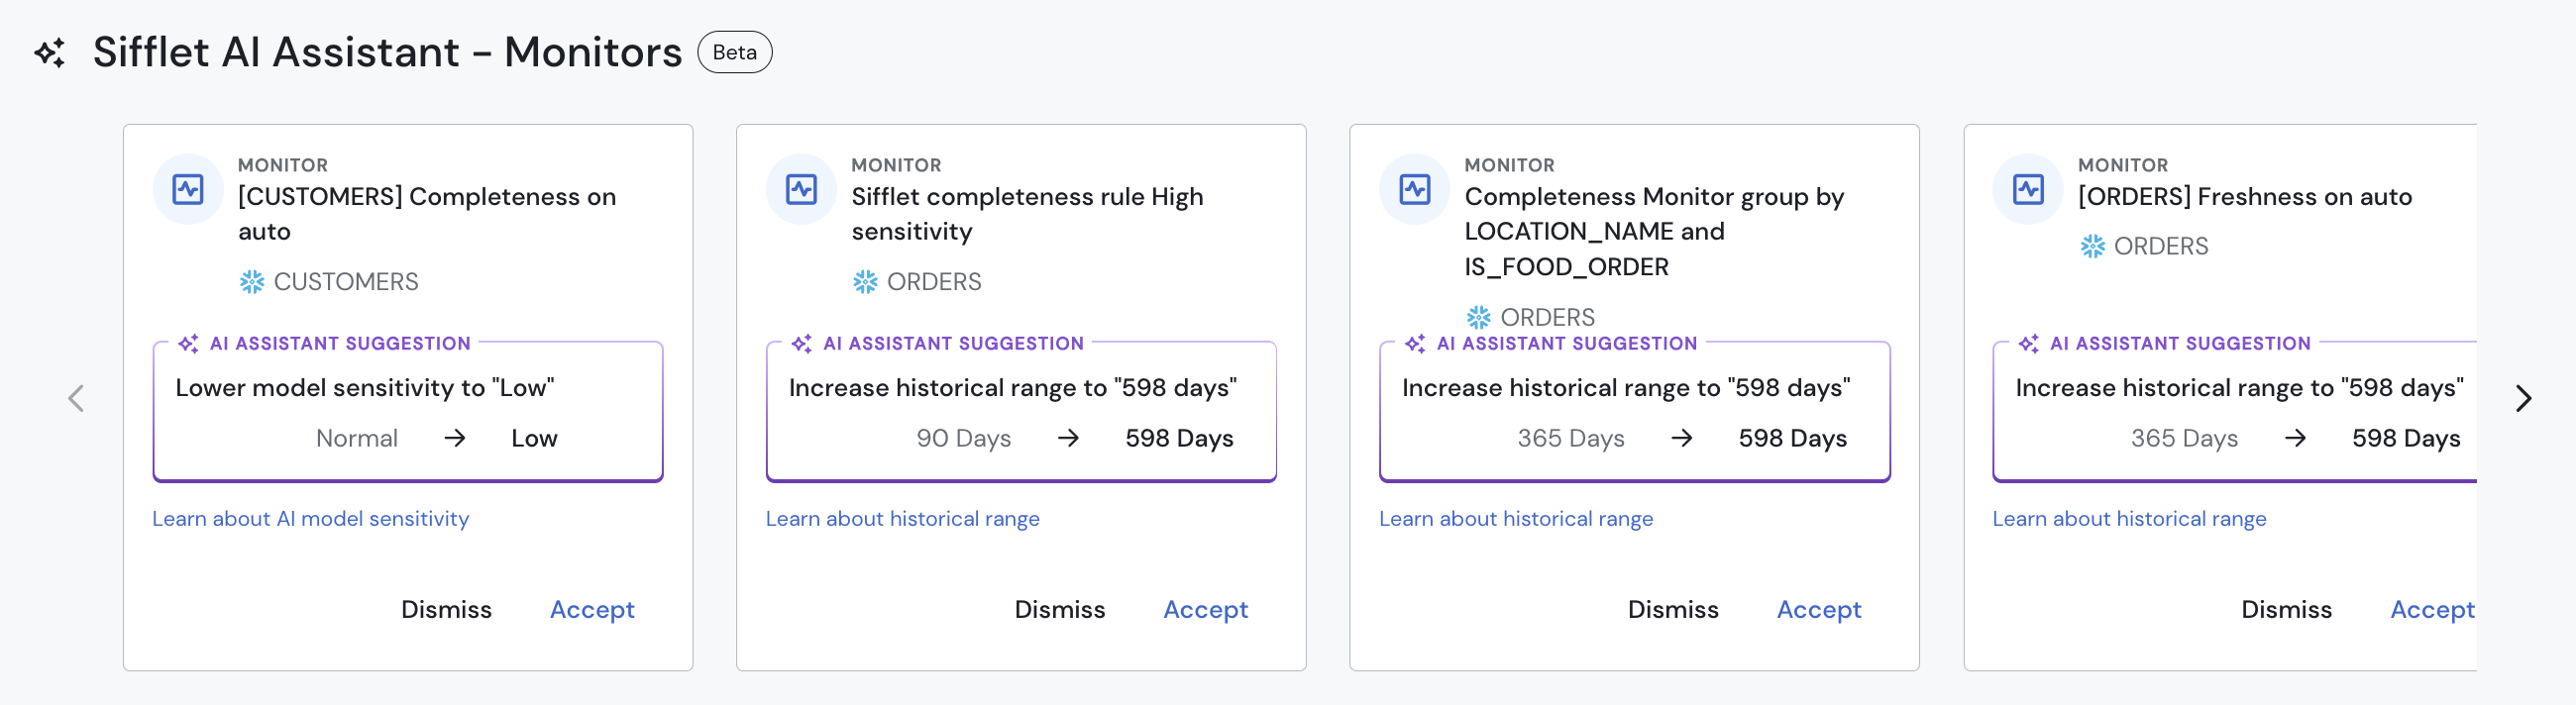
Dashboard "Sifflet AI Assistant - Monitors" Section
Updated 8 months ago