Asset Page
Overview
Asset pages provide you with more details on the metadata, the usage, the health state of your assets as well as the upstream and downstream dependencies, which allows you to:
- Learn more about your assets and what they are generally used for
- Troubleshoot data issues
- Ensure your data assets are correctly covered by your monitoring
Asset Page
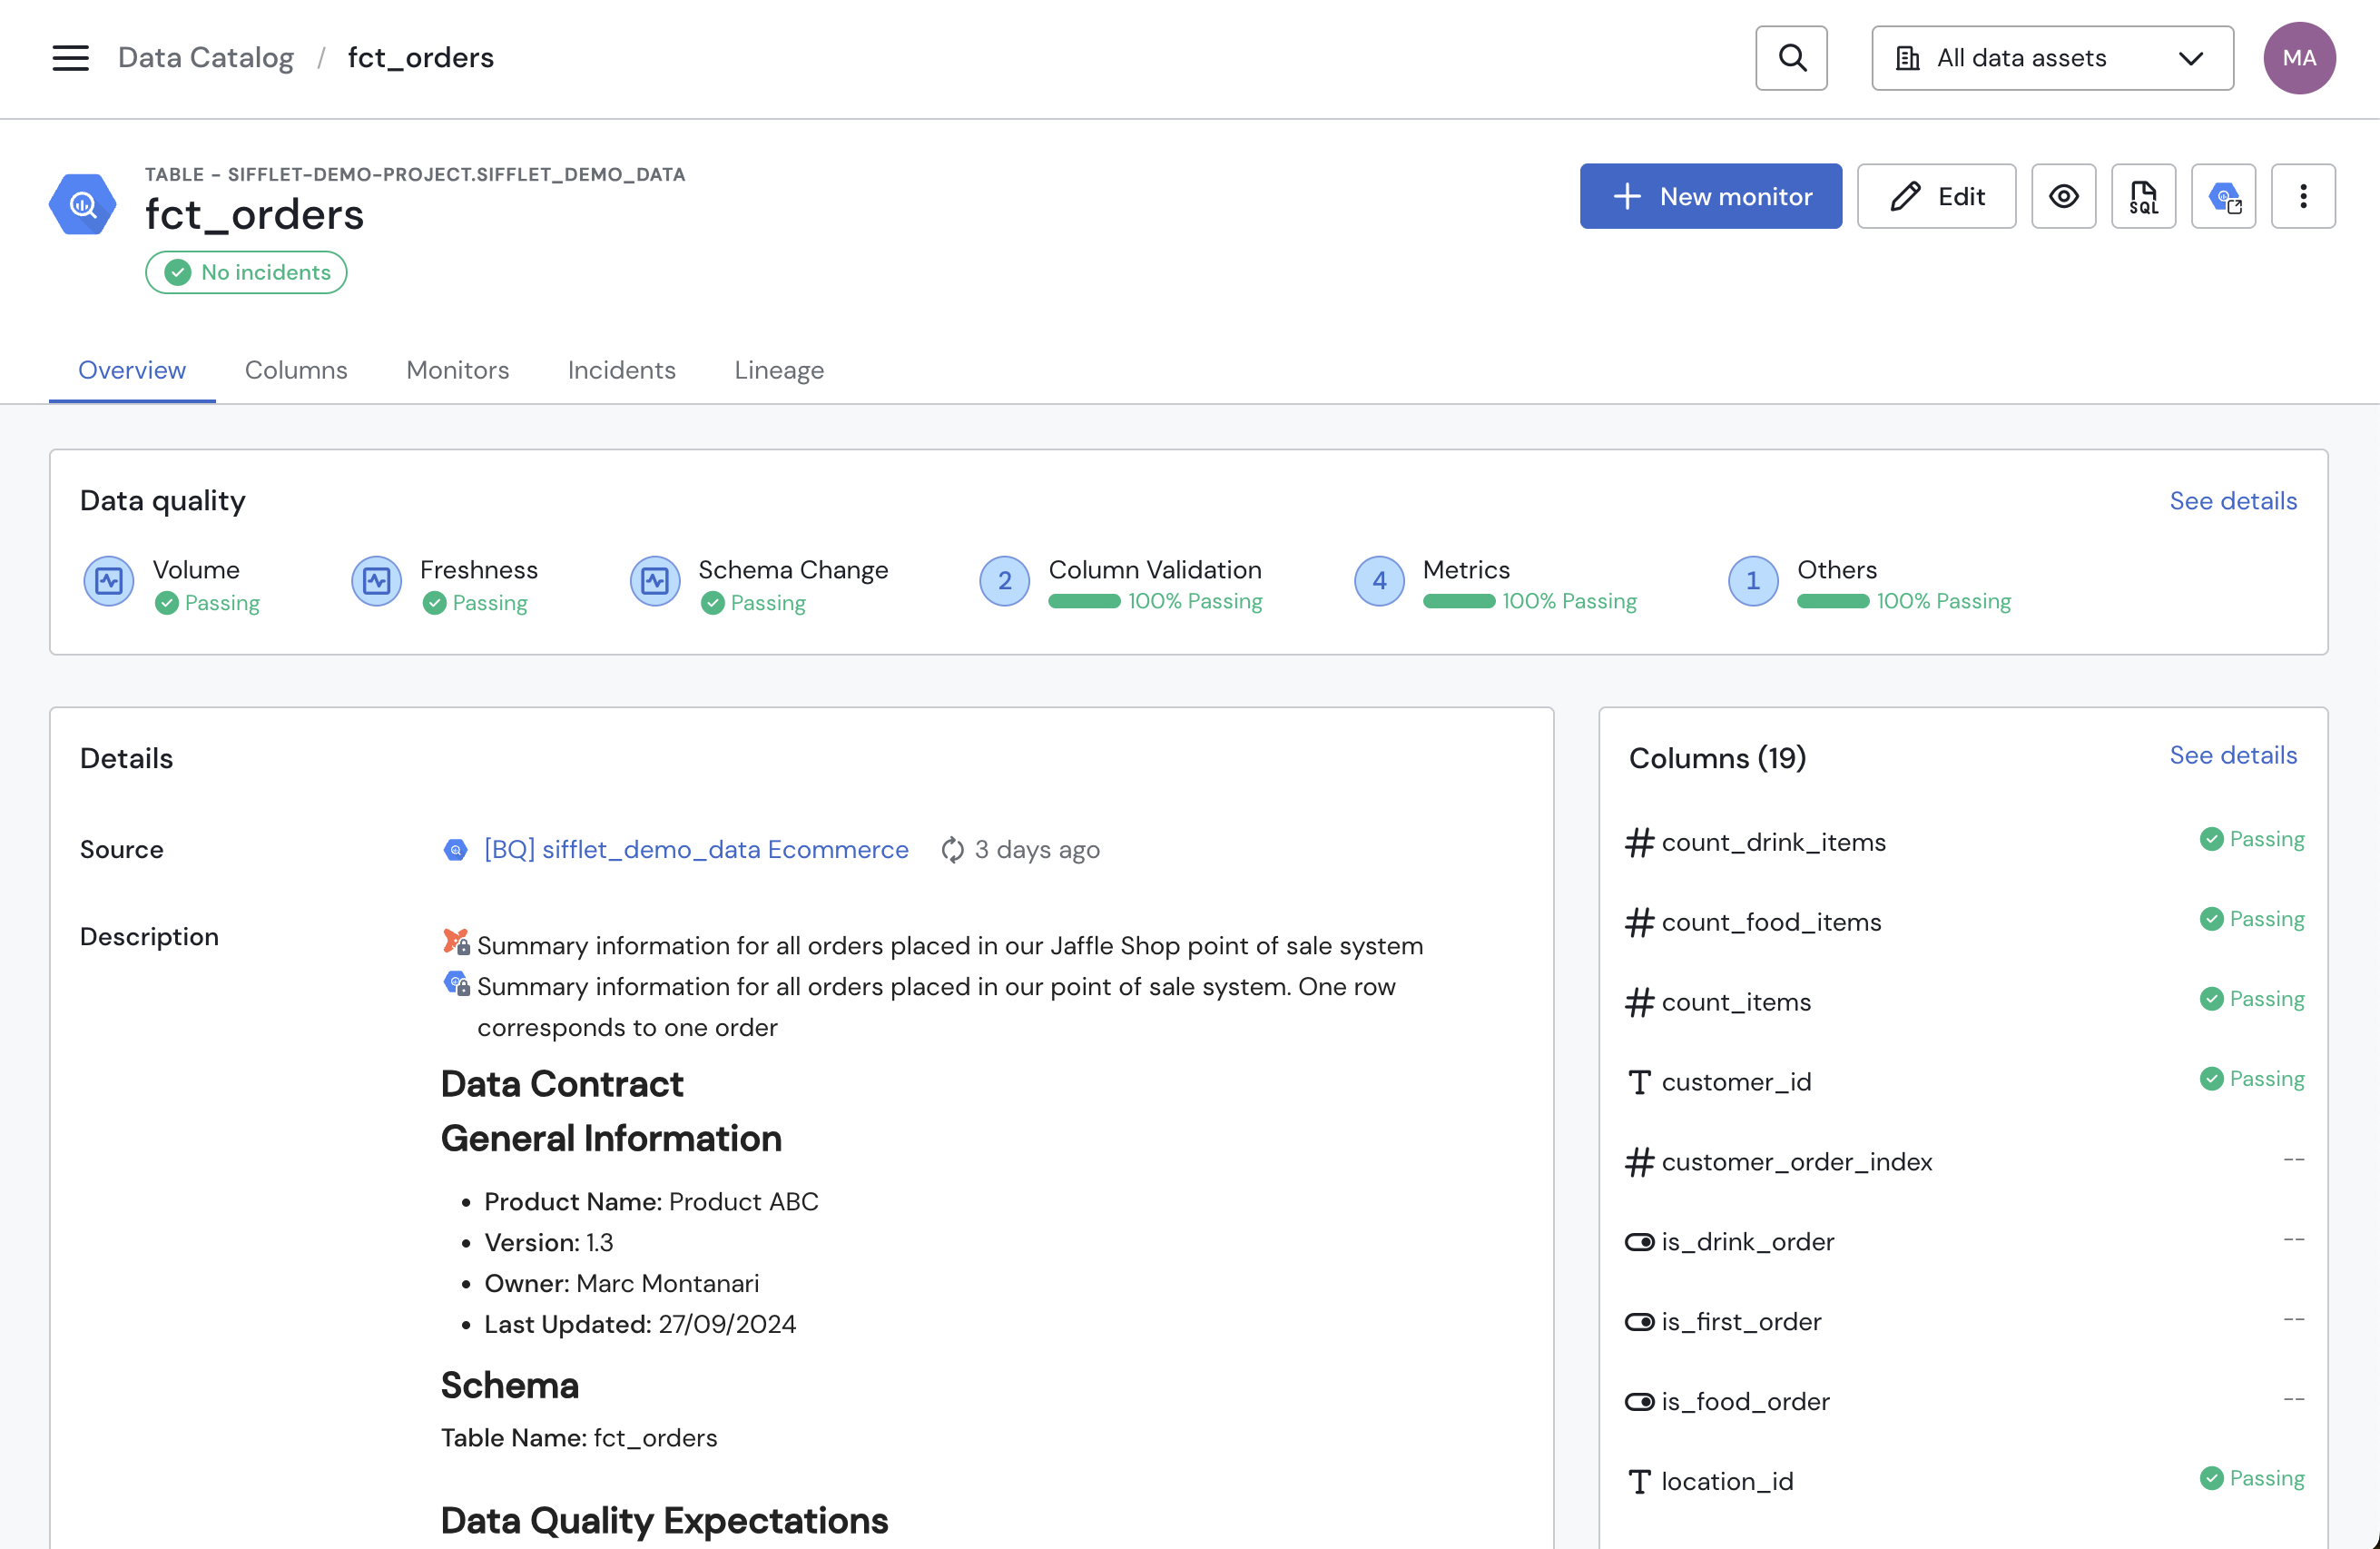
Header
The top of asset pages contains details about the asset's:
- Technology
- Type
- Fully qualified name: currently available for
Tables & Viewsassets and declared assets - Name
- Health status
It also allows you to perform various actions on your assets such as: creating a monitor on the asset, editing the asset, seeing the asset's associated SQL query, viewing the asset on its original technology platform, previewing data, pinning or unpinning the asset to your dashboard, or copying the asset's URI.
New monitor
Click the New Monitor button to start creating a monitor on your data asset.
Edit
Clicking the Edit button allows you to modify your data asset tags, business terms, description, and owners.
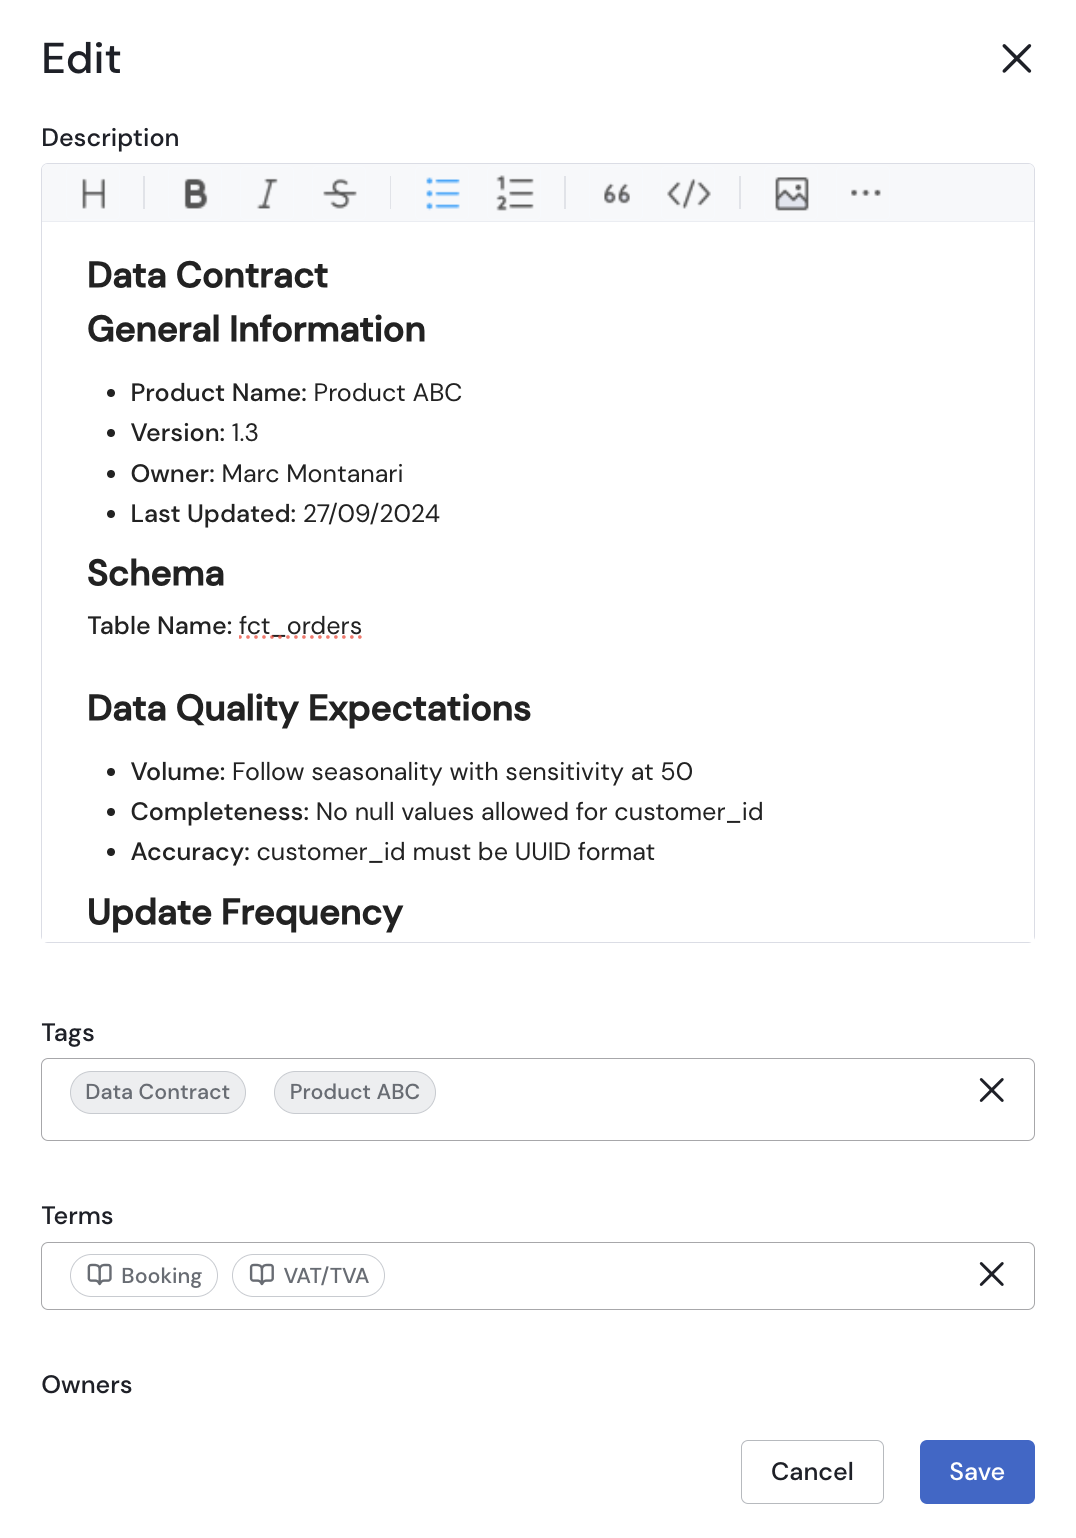
Tags, Business Terms, Description, Owners Edit
Preview data
Clicking Preview data allows you to preview the first rows of your Tables & Views data assets. To preview data:
- Select the number of rows you're interested in visualizing
- Tick the
Show all X columnscheckbox or use the dropdown menu to only tick the boxes associated with the columns you are interested in previewing. - A table showing the first rows of your
Tables & Viewsshows up.
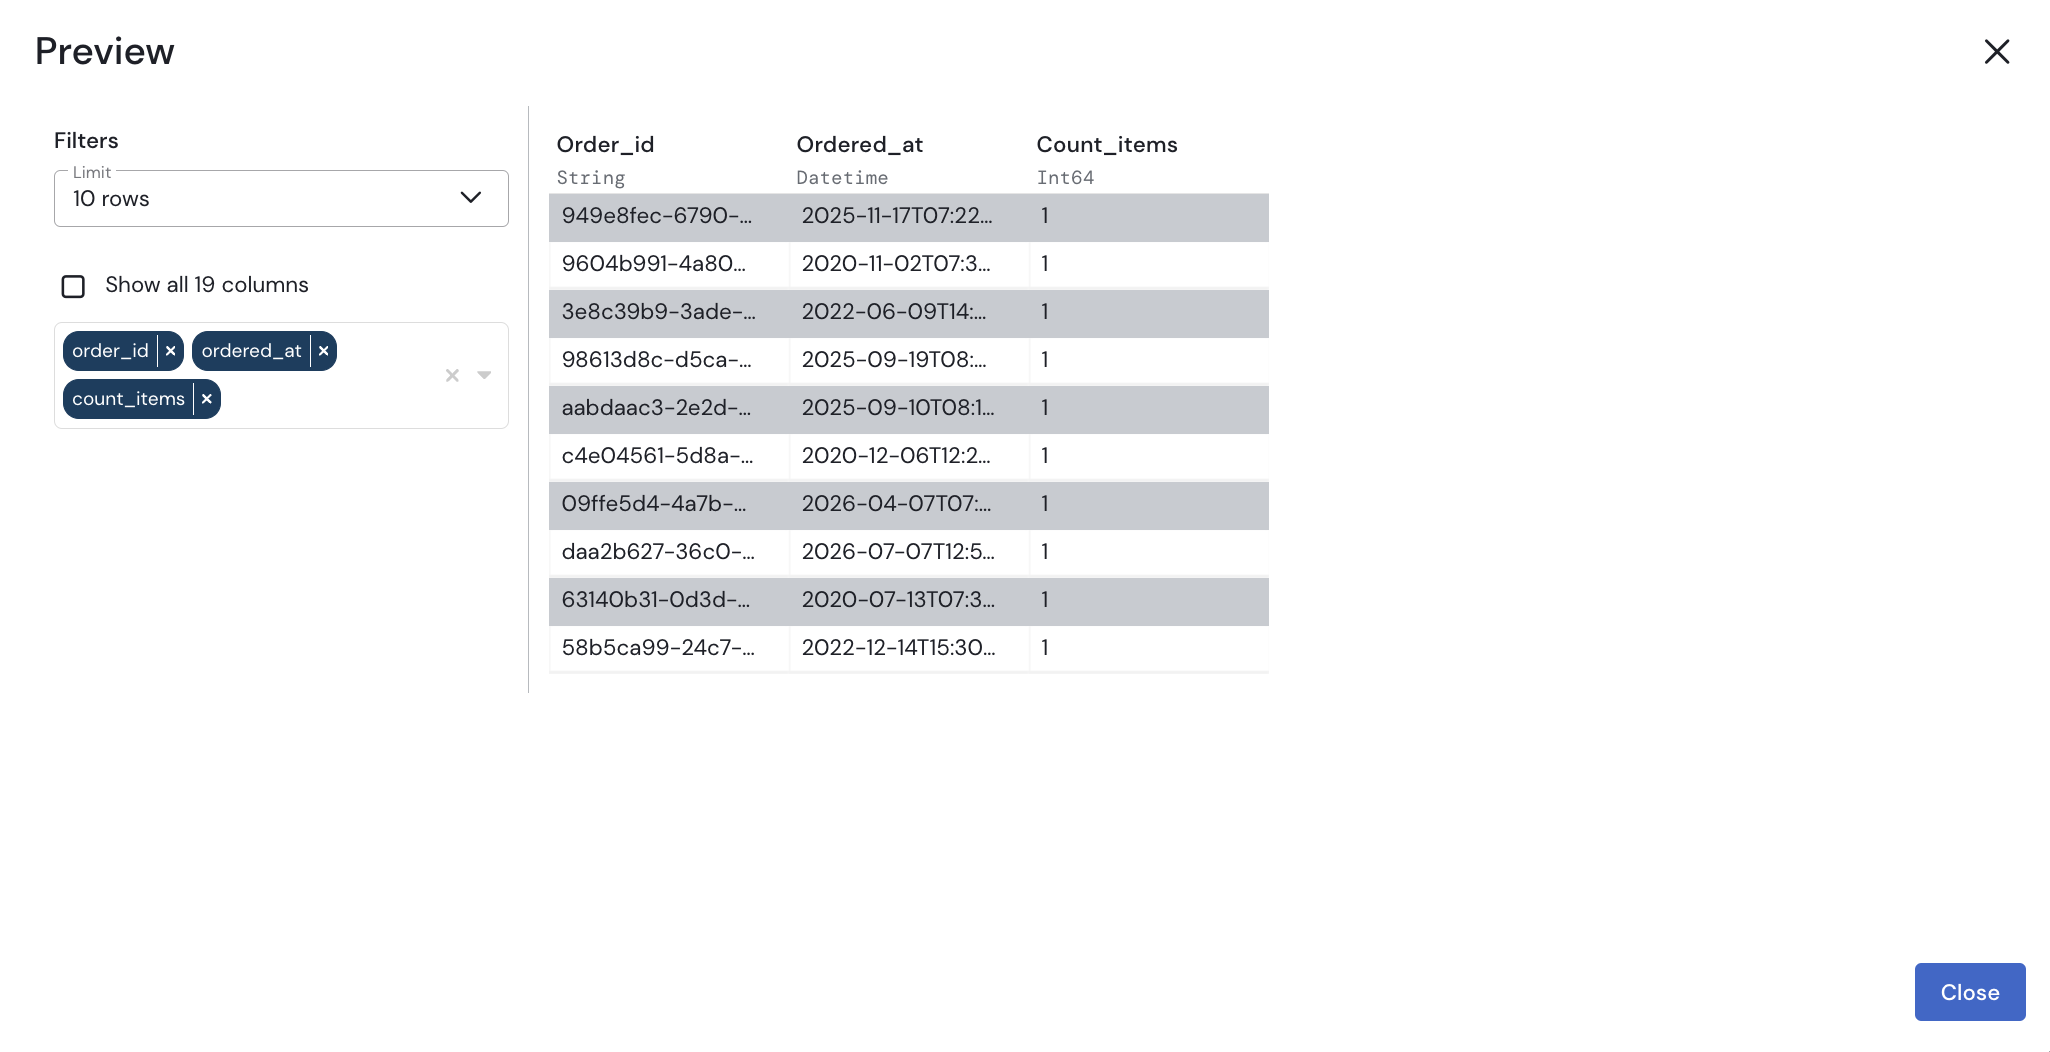
Previewing Data
Once you are done, click Close or the cross at the top of the modal.
The Preview Data feature can be disabled upon request. If you have any questions or would like to disable it for your tenant, please contact your Customer Success Manager.
SQL
Clicking the SQL button on your Tables & Views and Pipelines assets allows you to see the SQL query associated with your data assets. This often allows you to get even more details on how your data assets pertain to one another.
- For
Tables & Viewsassets, the SQL corresponds to the table or view creation query. - For
Pipelines(dbt models), the shown SQL corresponds to the dbt model source code. If you're interested in the compiled version of the dbt model source code, you should be able to find it looking at the SQL of the model's downstream assets.
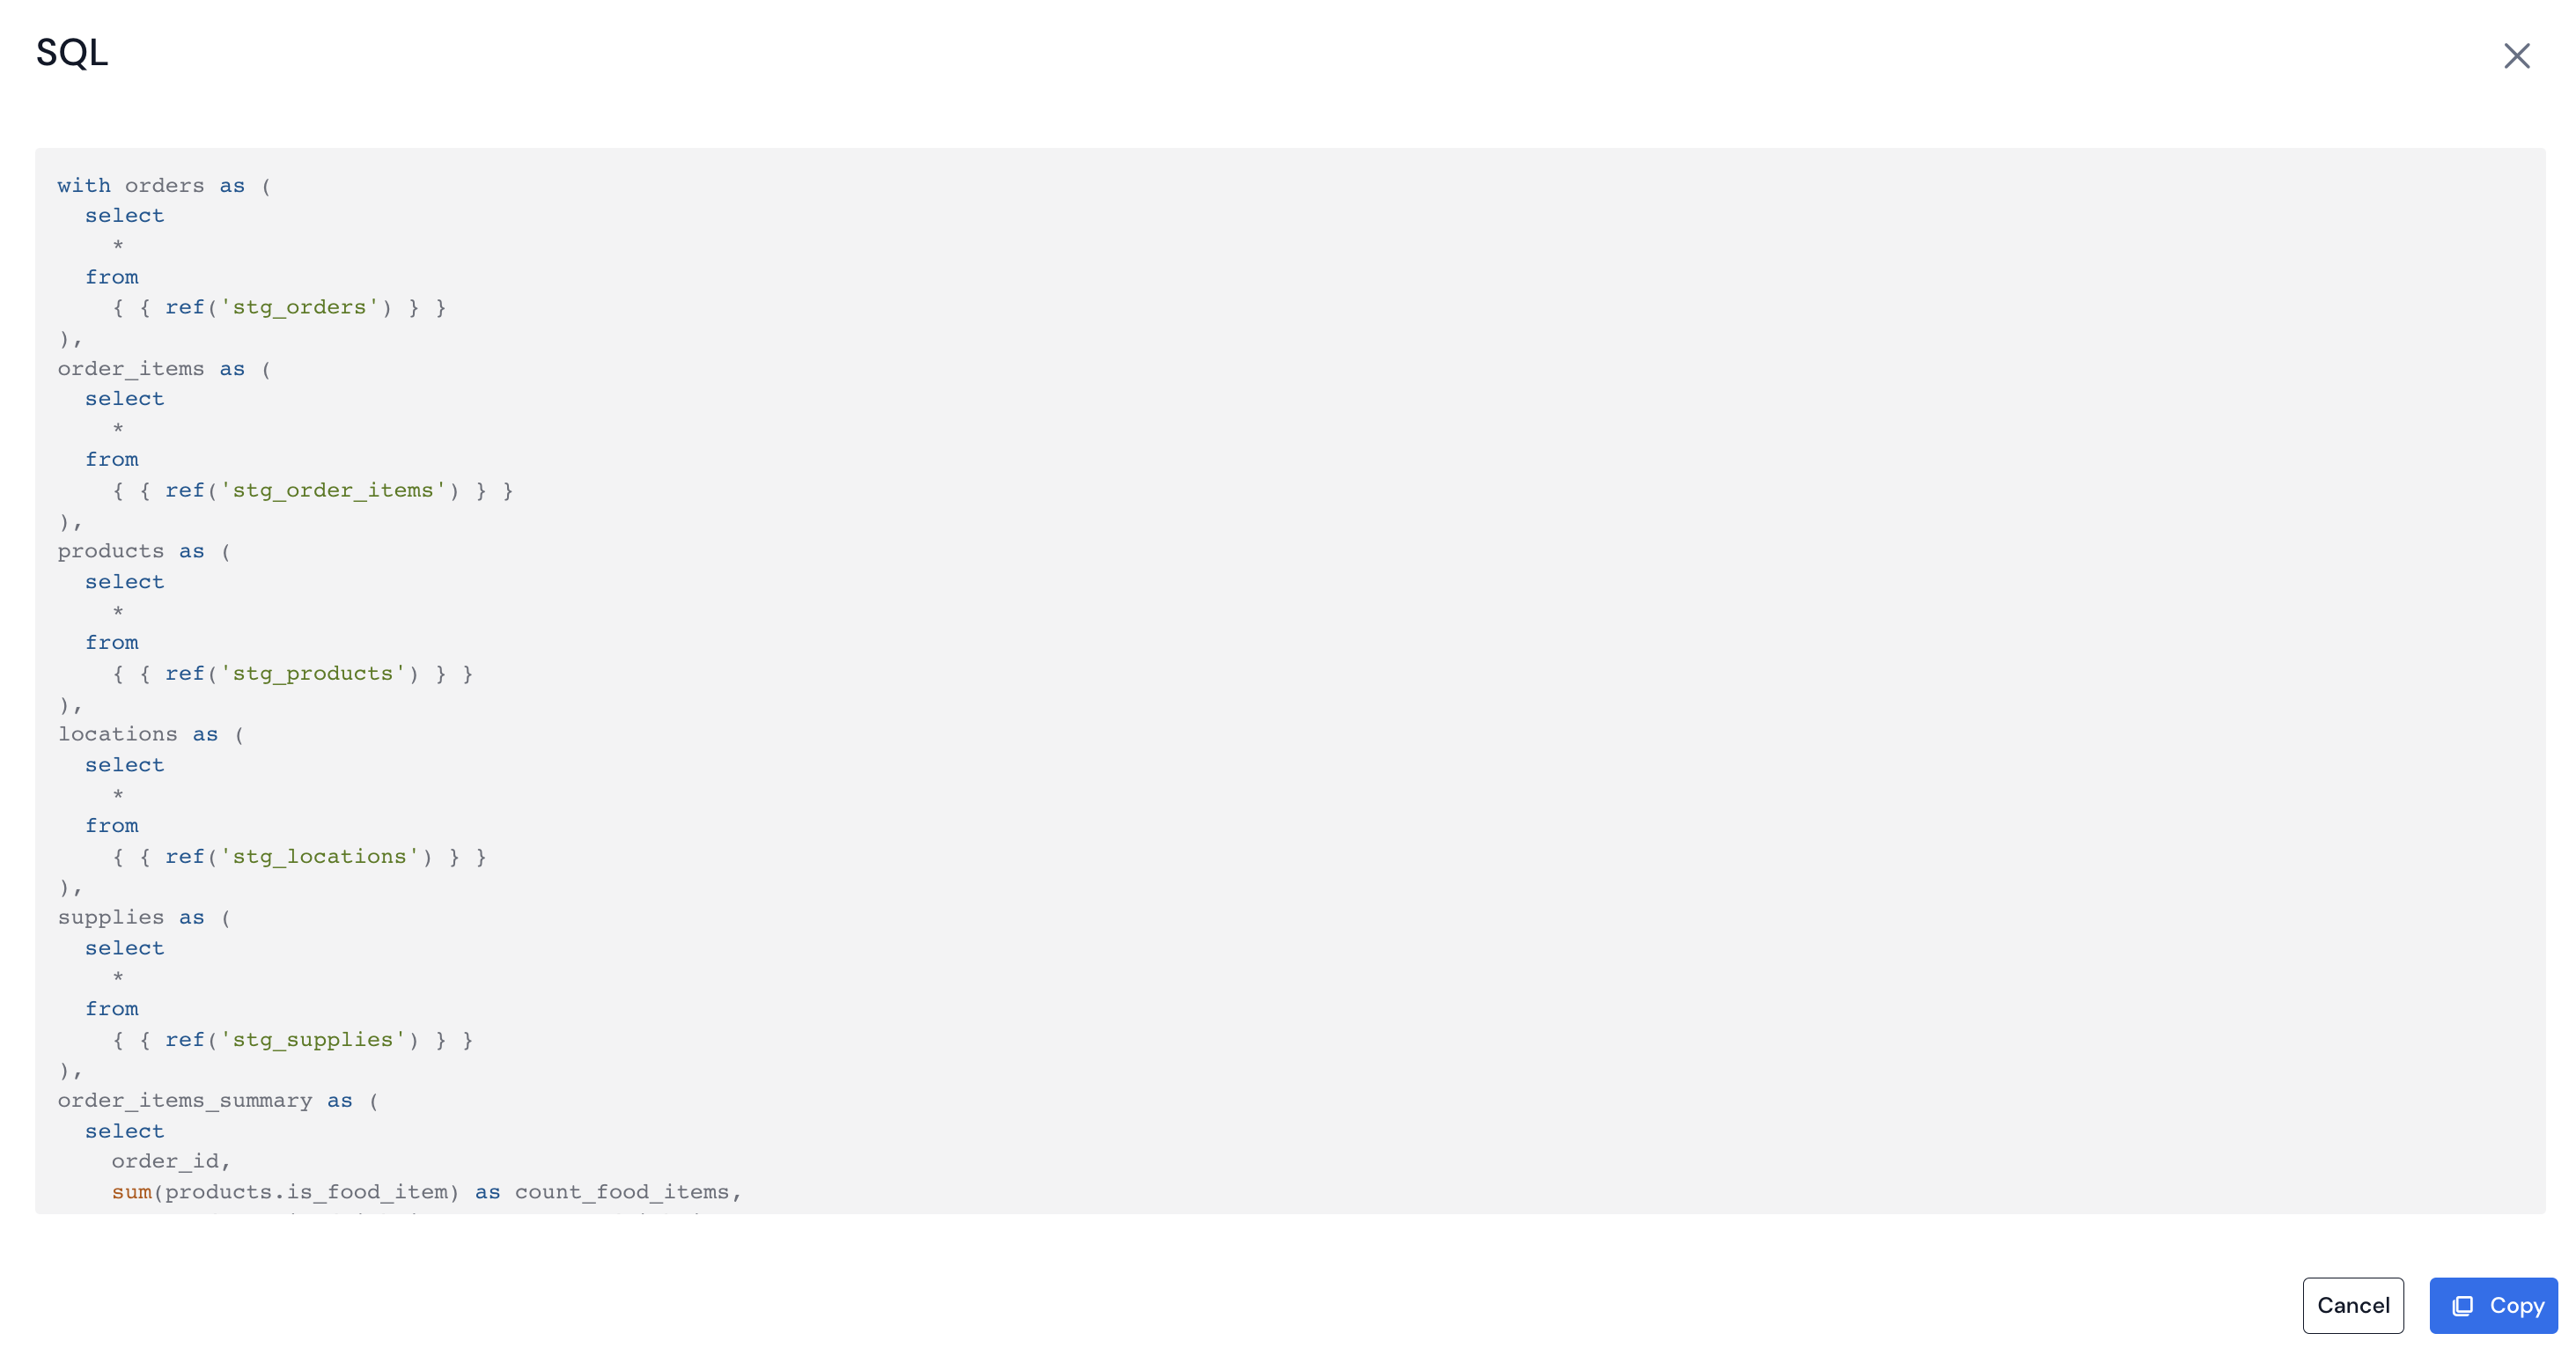
SQL Query
View in
Click the View in <TECHNOLOGY_NAME> button to open the asset on its original technology platform in a new tab. This is currently available for BI integrations as well as Snowflake, BigQuery, and Databricks.
Generate metadata
Sifflet automatically generates classification tags and description AI suggestions for your Tables & Views assets.
Pin/Unpin
Clicking the Pin button allows you to pin your data asset to your Dashboard page in order to be able to quickly access it when landing on Sifflet's homepage.
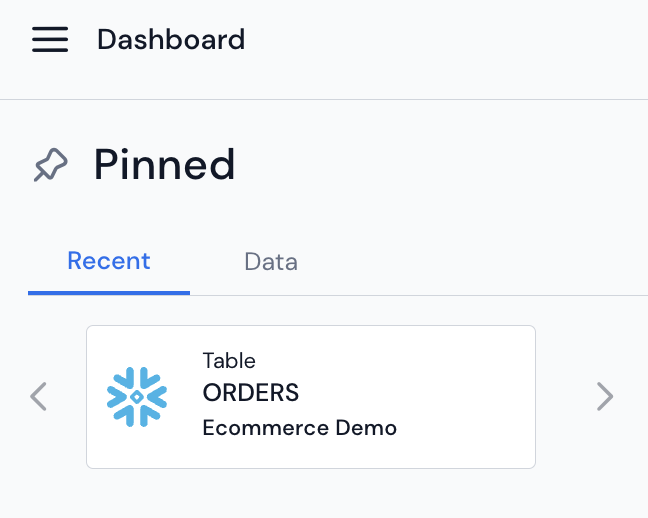
Pinned Data Asset
To unpin a data asset from your dashboard, click the Unpin button.
Copy data asset URI
Click the Copy data asset URI button to copy the asset URI to your clipboard. This is useful when you want to interact with data assets programmatically (e.g. via API endpoints, monitors as code, etc.).
Overview Tab
The Overview tab provides you with general information about your asset metadata and overall health status.
Data quality Section
The Data Quality section is available for Tables & Views assets. It breaks the asset health status that's available in the header down into more detailed insights by showing an overview of the table's health based on the monitors running against it. It details the following dimensions:
- Volume
- Freshness
- Schema Change
- Column Validation
- Metrics
- Others

Data quality Section
Details Section
The Details section contains details about your asset:
- Sifflet source name and last refresh date
- Description, which can be automatically extracted from your source and/or manually edited by your team on Sifflet
- Tags
- Business terms
- Domains
- Owners
- Data usage (only
Tables & Views,Dashboards) - Time windows & offset (only
Tables & Views)
Columns Section
The Columns section provides you with the number of columns as well as the list of column names and types of your Tables & Views assets. It also features the health status associated with each of your monitored column. Clicking See details redirects you to the Columns tab which contains more details about the content of your tables, its different versions, etc.
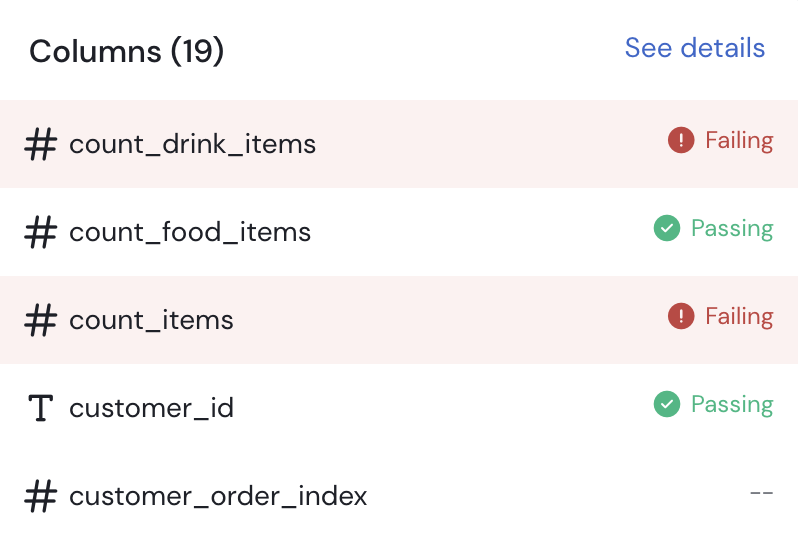
Data Asset Columns
Columns Tab
The Columns tab provides you with the total number of columns on your asset as well as detailed information about each individual column of your Tables & Views assets:
- Column name
- Column type
- Column tags (regular tags or classification tags) and business terms
- Status, indicates the health status of monitors running against this specific column
- Column description, automatically extracted from your data source and/or manually edited by your team on Sifflet
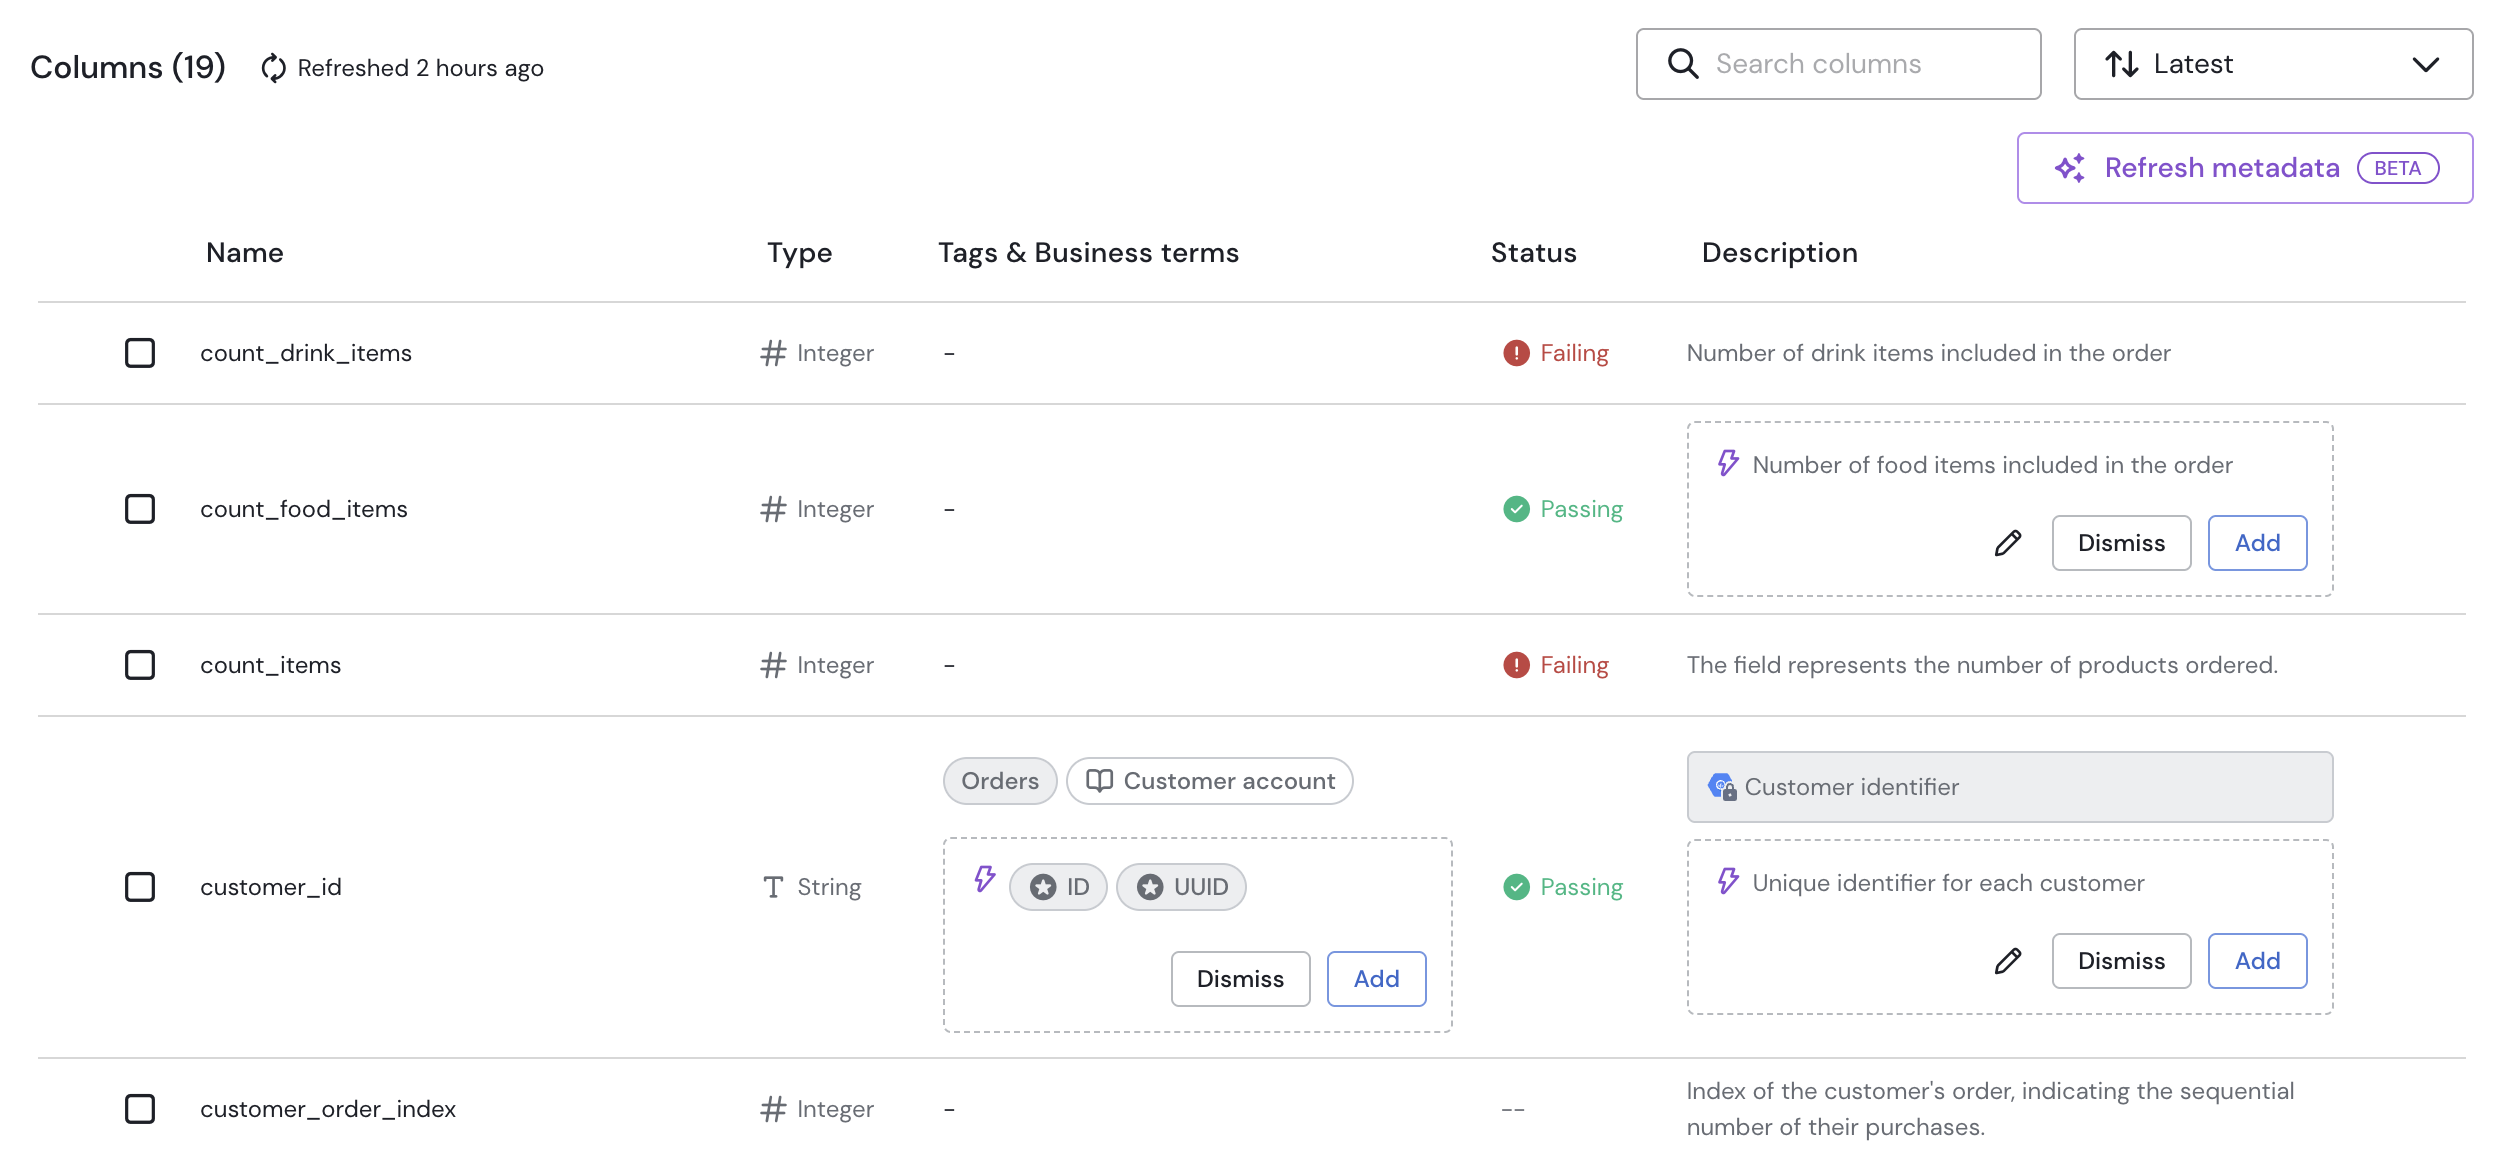
Data Asset Columns
Edit
Clicking the pencil icon at the end of any field row allows you to modify your fields' tags, terms, and descriptions.

Single Field Editing
You can also tick multiple fields to bulk edit their tags, terms , and descriptions.
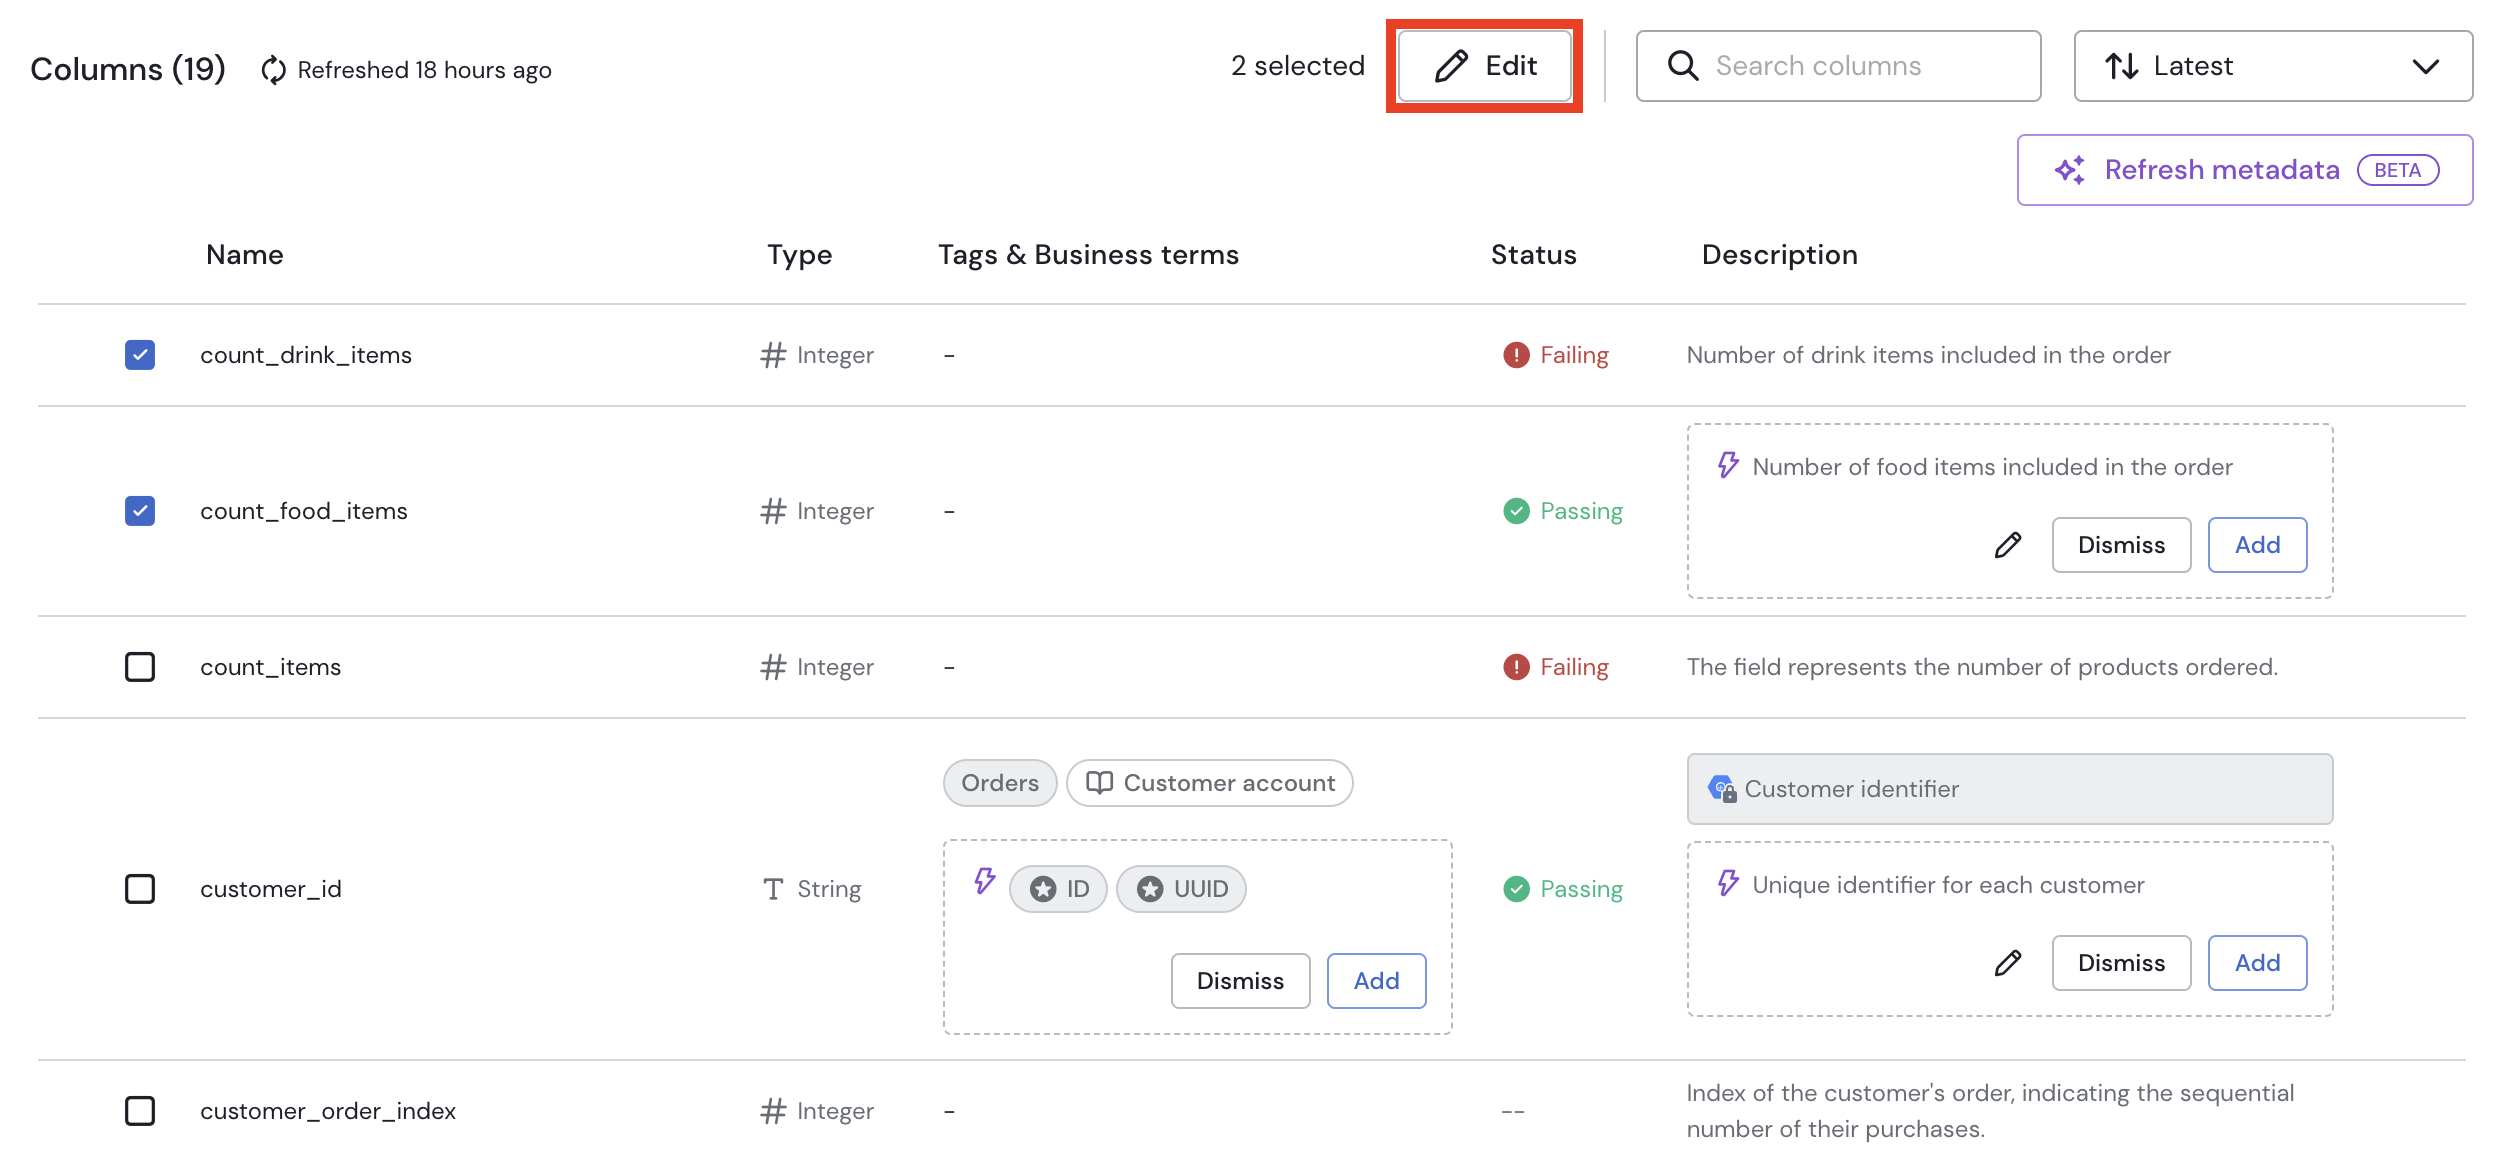
Field Bulk Editing
Search columns
You can use the search bar to quickly sift through your columns and find the one you are interested in. The search is performed on column names.
Columns Search Bar
Versions
The version dropdown menu allows you to navigate through the different versions of your Tables & Views assets schemas.
Schema versions are stored and surfaced on the asset page only if a schema change monitor has been created and run on the asset.
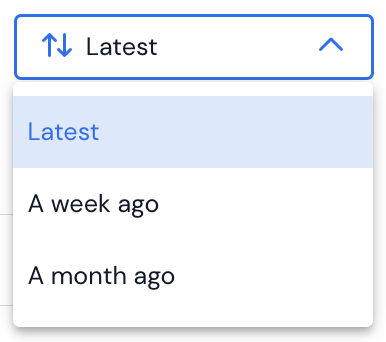
Schema Version Dropdown
Monitors Tab
The Monitors tab of Tables & Views assets displays all monitors configured on your data asset, allowing you to assess your asset health state of your asset as well as its monitoring coverage.
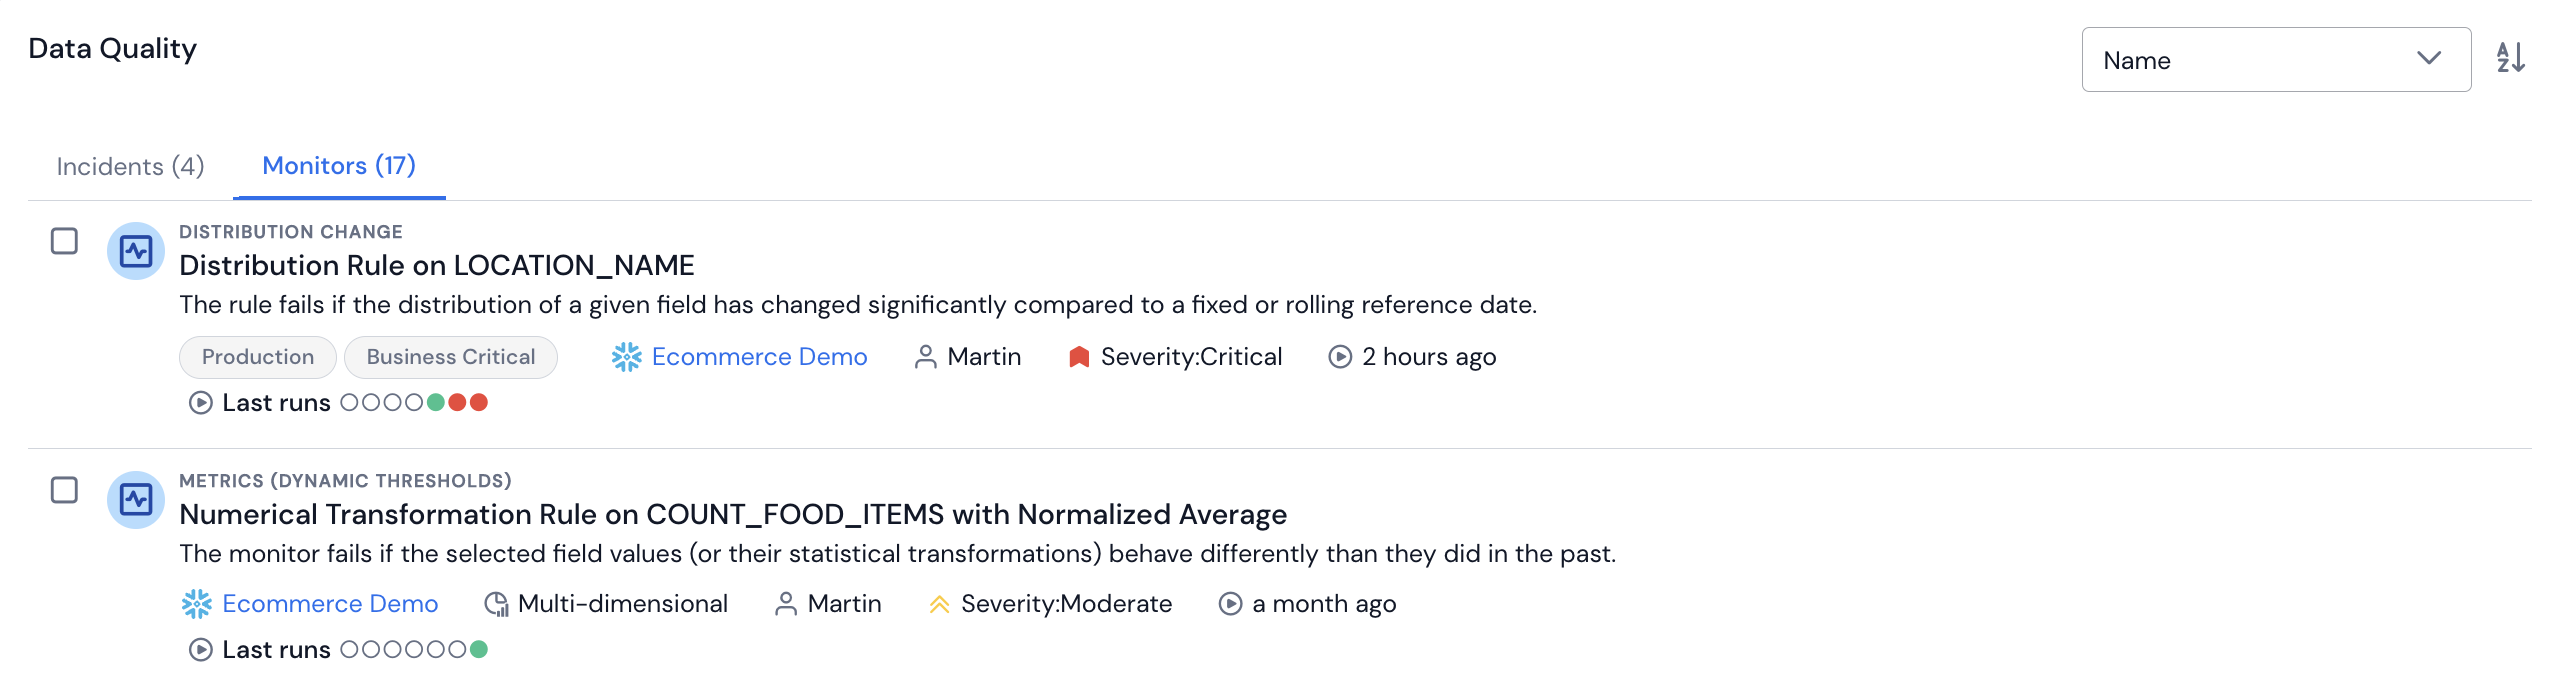
Data Asset Monitors
Incidents Tab
The Incidents subtab of Tables & Views assets displays any ongoing incidents that might be linked to your data asset.
Toggling on Show closed incidents allows you to look at both ongoing and closed incidents, making it easy for you to spot any patterns in the anomalies occurring on a given asset.
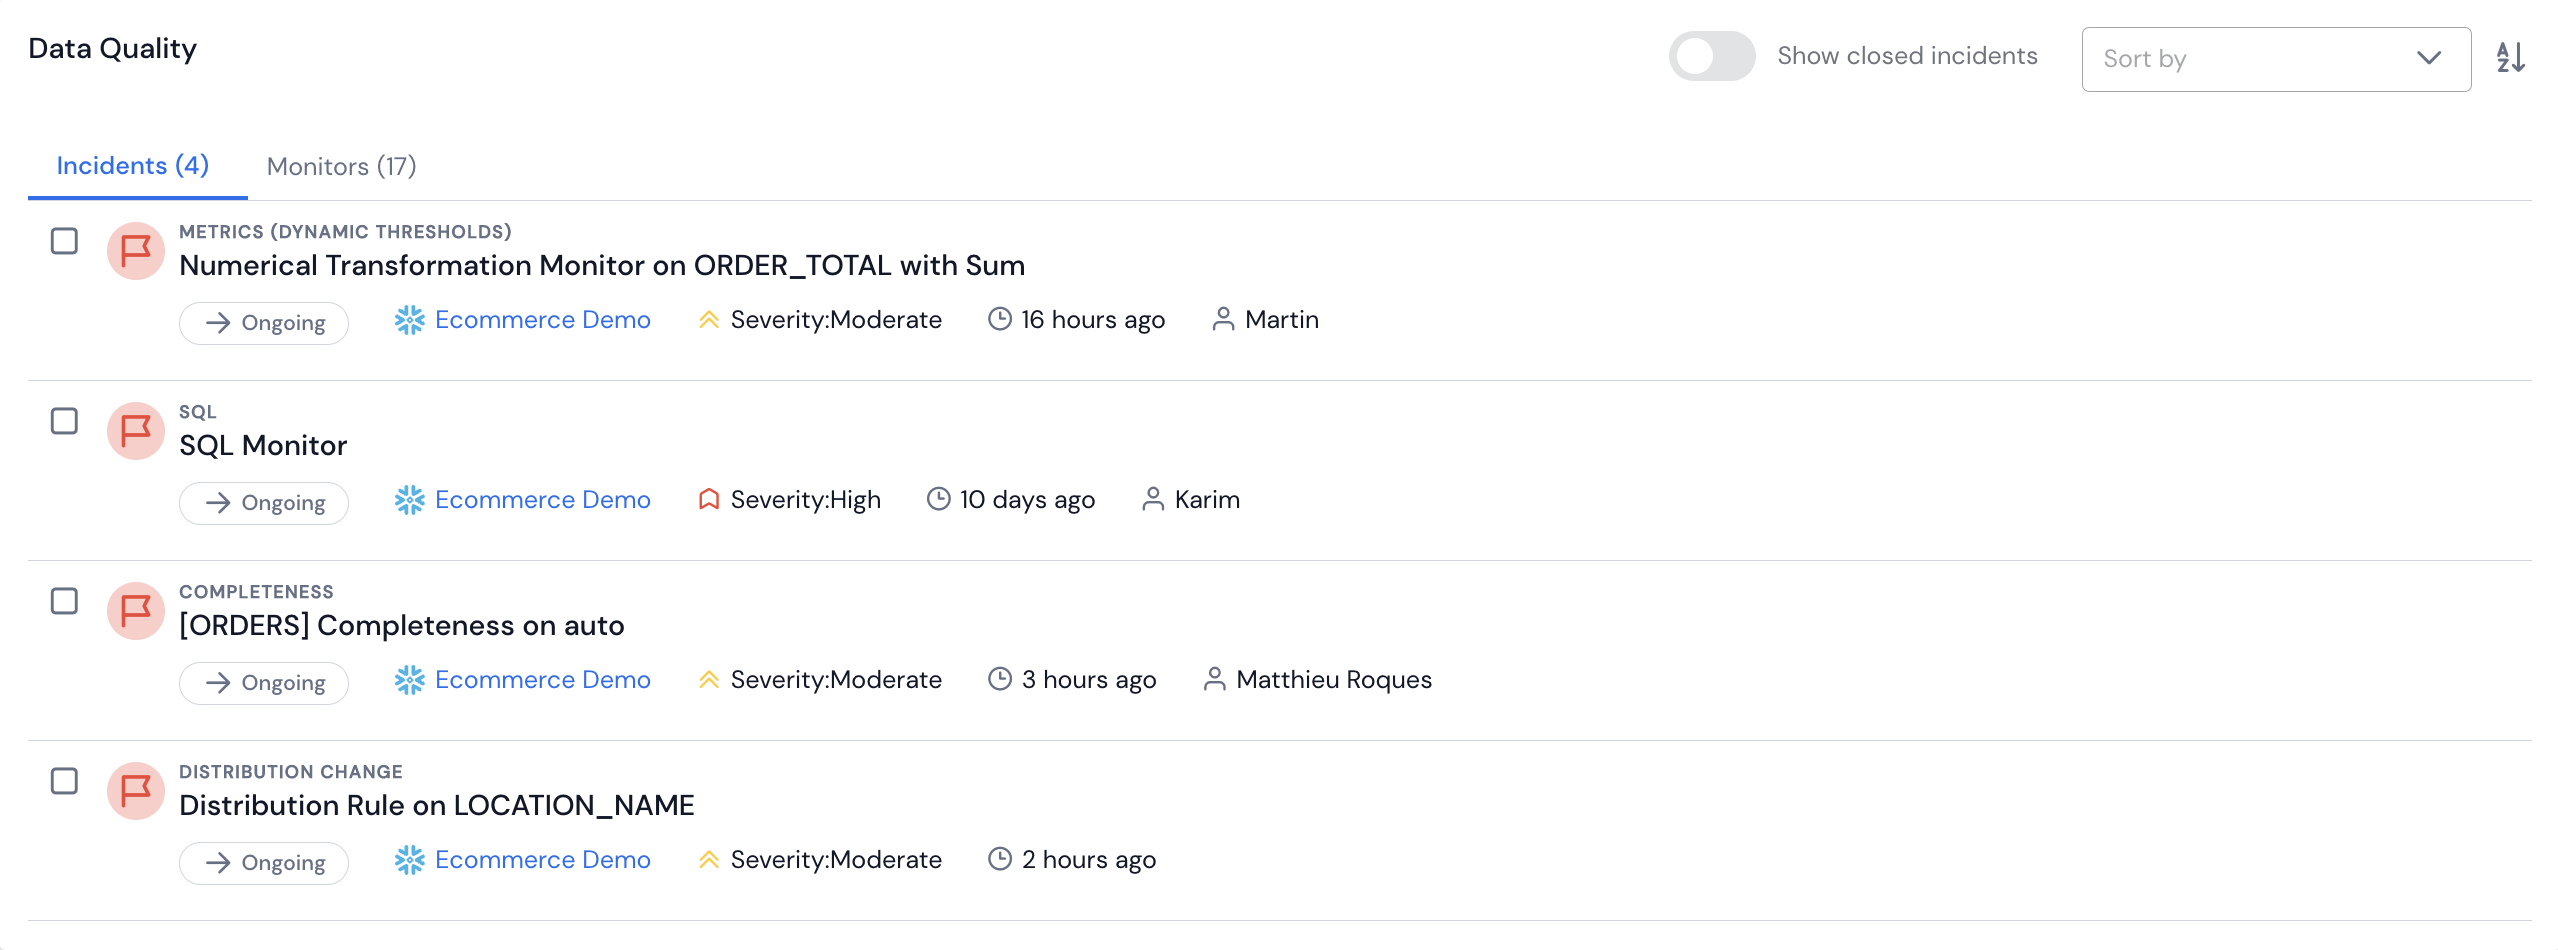
Data Asset Incidents
Lineage Tab
The Lineage tab displays all the interactions between your assets down to the field level. You can look either upstream or downstream to perform root cause analyses or impact assessment. For more information, look at this specific section.
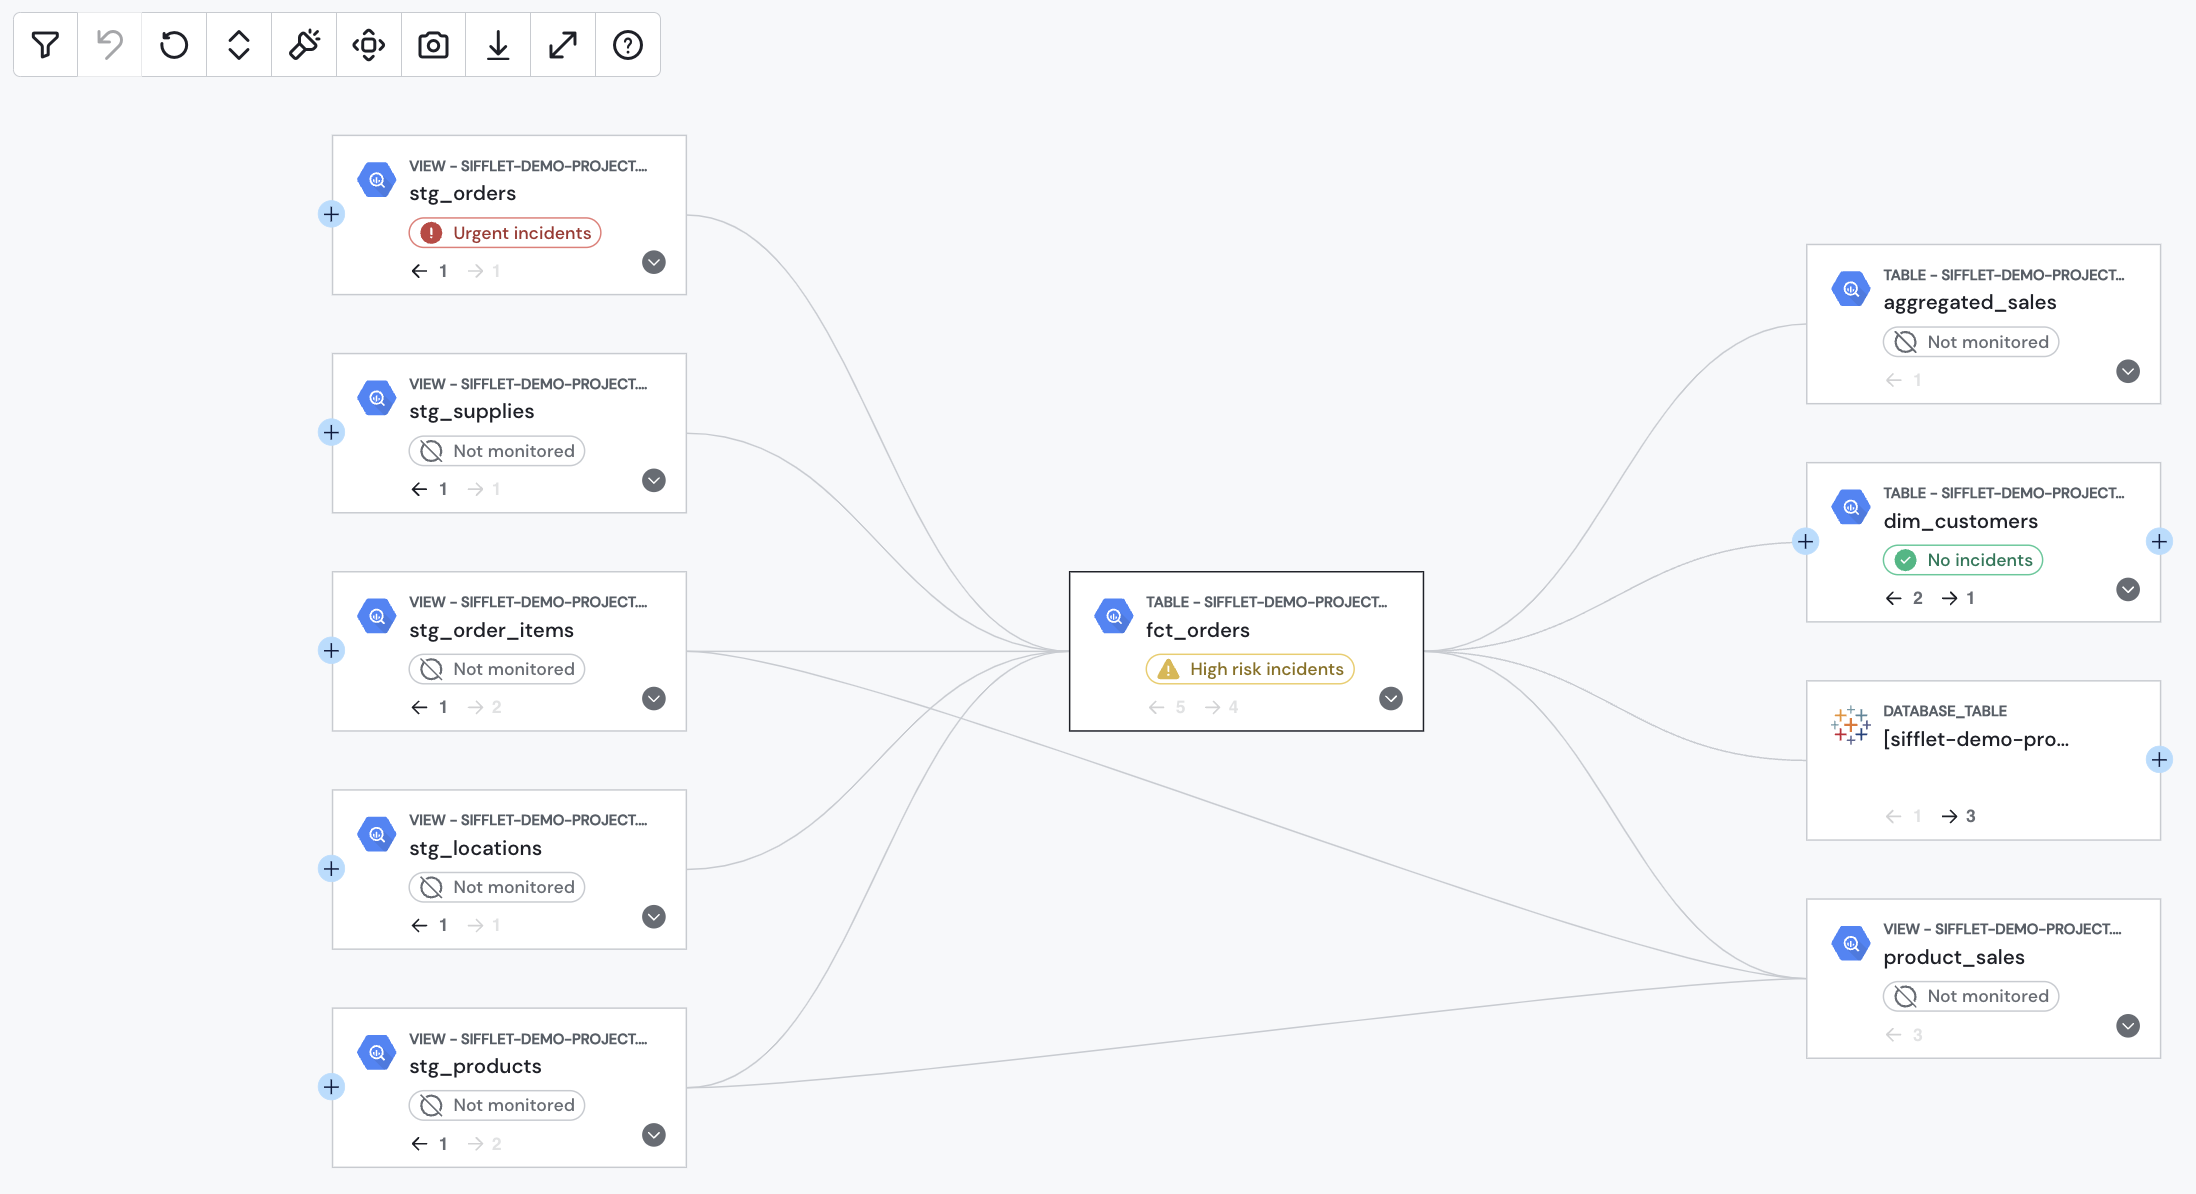
Data Asset Lineage
Updated 3 days ago