Distribution change
Overview
The Sifflet Distribution Change Monitor is a field-profiling tool designed to detect changes in the volume percentage of categories within a dataset. It helps identify distribution anomalies, either through dynamic detection or static comparison.
How to
How does it work
The Sifflet Distribution Change Monitor calculates the volume percentage of each distinct value within the monitored column and compares the resulting distribution either against a defined threshold or historical reference data.
The column can contain values of any type, as long as the cardinality remains within the supported limit.
Limit on the number of categoriesSifflet limits the number of categories to 1200. Above this threshold, the rule will throw a "technical error" status.
How to configure
The template "Distribution Change" can be found in the "Field Profiling" Category.
Two options:
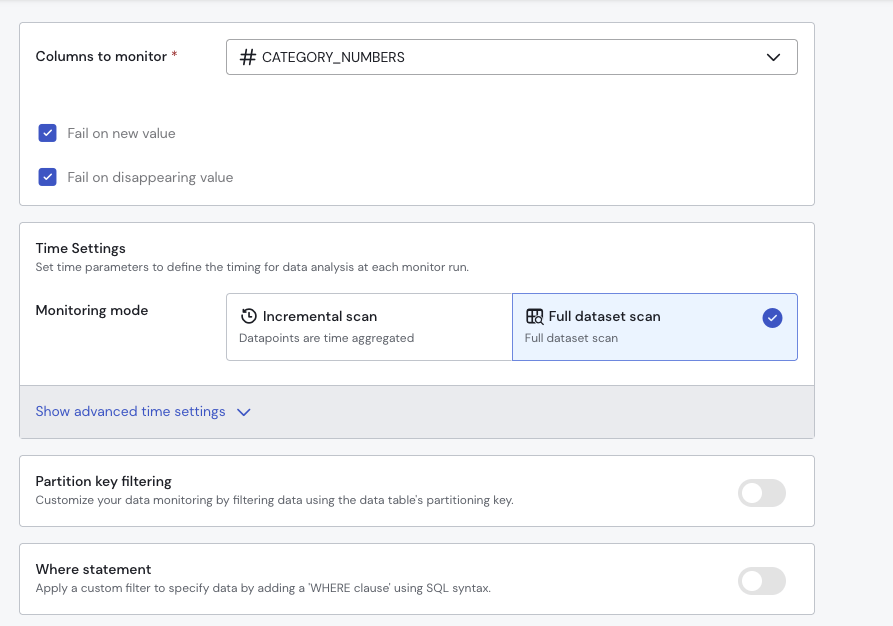
After selecting the column(s) to monitor, you can enable the following options:
- Fail if new category appears – The monitor will fail if a previously unseen category (or combination of categories) is detected.
- Fail if category disappears – The monitor will fail if an expected category (or combination of categories) is missing from the data.
Monitoring Type - Dynamic, Static, Relative
You can choose as usual between dynamic and static thresholds.
Dynamic
The rule fails if the statistical test finds any anomaly based on the previous trends. There is no need to define a threshold but you need to set a sensitivity.
Static mode
The rule uses a predefined threshold as a reference. The monitor will fail if any category’s volume percentage increases or decreases beyond the specified threshold compared to the reference distribution.
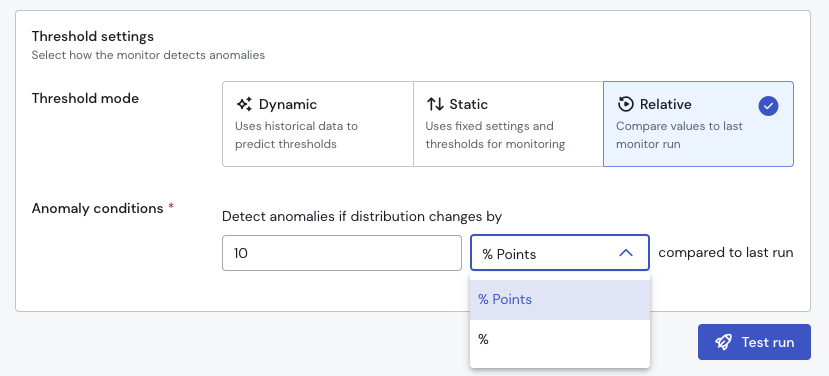
Relative Mode
In Relative mode, the monitor evaluates changes in category volume percentages using one of two comparison methods:
- % change – Compares the percentage increase or decrease relative to the previous value.
Example: A change from 10% to 20% is considered a 100% increase. - % points change – Compares the absolute difference in percentage points.
Example: A change from 10% to 20% is considered a 10 percentage point increase.
Updated about 1 month ago