Automatic Monitoring
Access: Admins only
Navigation: Settings → Automatic Monitoring
Sifflet's Automatic Monitoring allows administrators to easily monitor entire schemas or databases using default monitors. This feature enables fast, cost-effective monitoring by leveraging metadata and system-level configurations.
Overview
When enabled, Sifflet will automatically monitor all tables within the selected schemas or databases. This includes tables added in the future—Sifflet will detect and begin monitoring them without additional configuration.
Available Automatic Monitors
The following monitors can be applied automatically:
-
Freshness (Metadata):
Dynamically alerts if the time since the last update exceeds expected thresholds.
Runs every hour. -
Volume (Full Table Scan):
Dynamically alerts if the total number of rows in the table significantly diverges from historical norms.
Runs daily at midnight UTC -
Schema Change:
Alerts when a table’s schema changes—for example, when a column is added or removed.
Runs daily at midnight UTC
These monitors query only metadata and are designed to be lightweight, incurring minimal or no cost on your warehouse.
Monitor Creation Scope
- Applies only to Tables
- Future support planned for Views and other dataset types
- Currently limited to 8000 monitored datasets
Enabling Automatic Monitoring
- Navigate to
Settings→Automatic Monitoring - Select schemas or databases to be automatically monitored
- Sifflet will begin creating monitors for all detected tables in those schemas
Only Admins can enable or manage Automatic Monitoring.
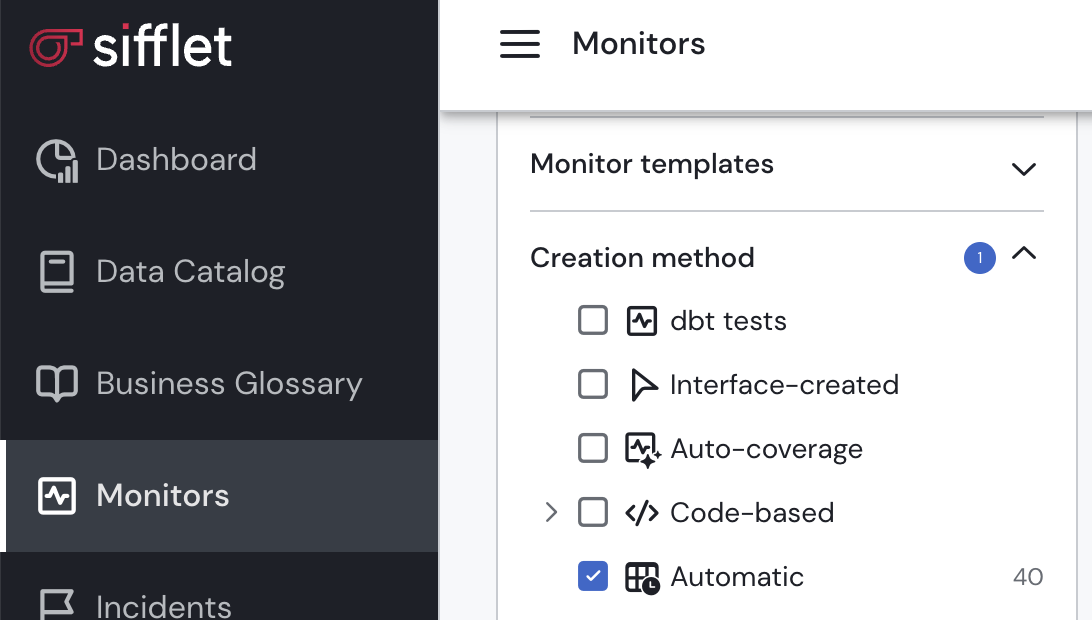
Viewing and Filtering Monitors
All automatically created monitors are visible on the Monitors page. You can filter them by Creation Method using the sidebar:
Automaticdbt testsInterface-createdAuto-coverageCode-based
Notes
- Monitor availability may vary depending on your data platform (e.g., Freshness Metadata is not available for Athena, MySQL, Postgres and Synapse).
Updated 7 months ago