Monitor Results
Overview
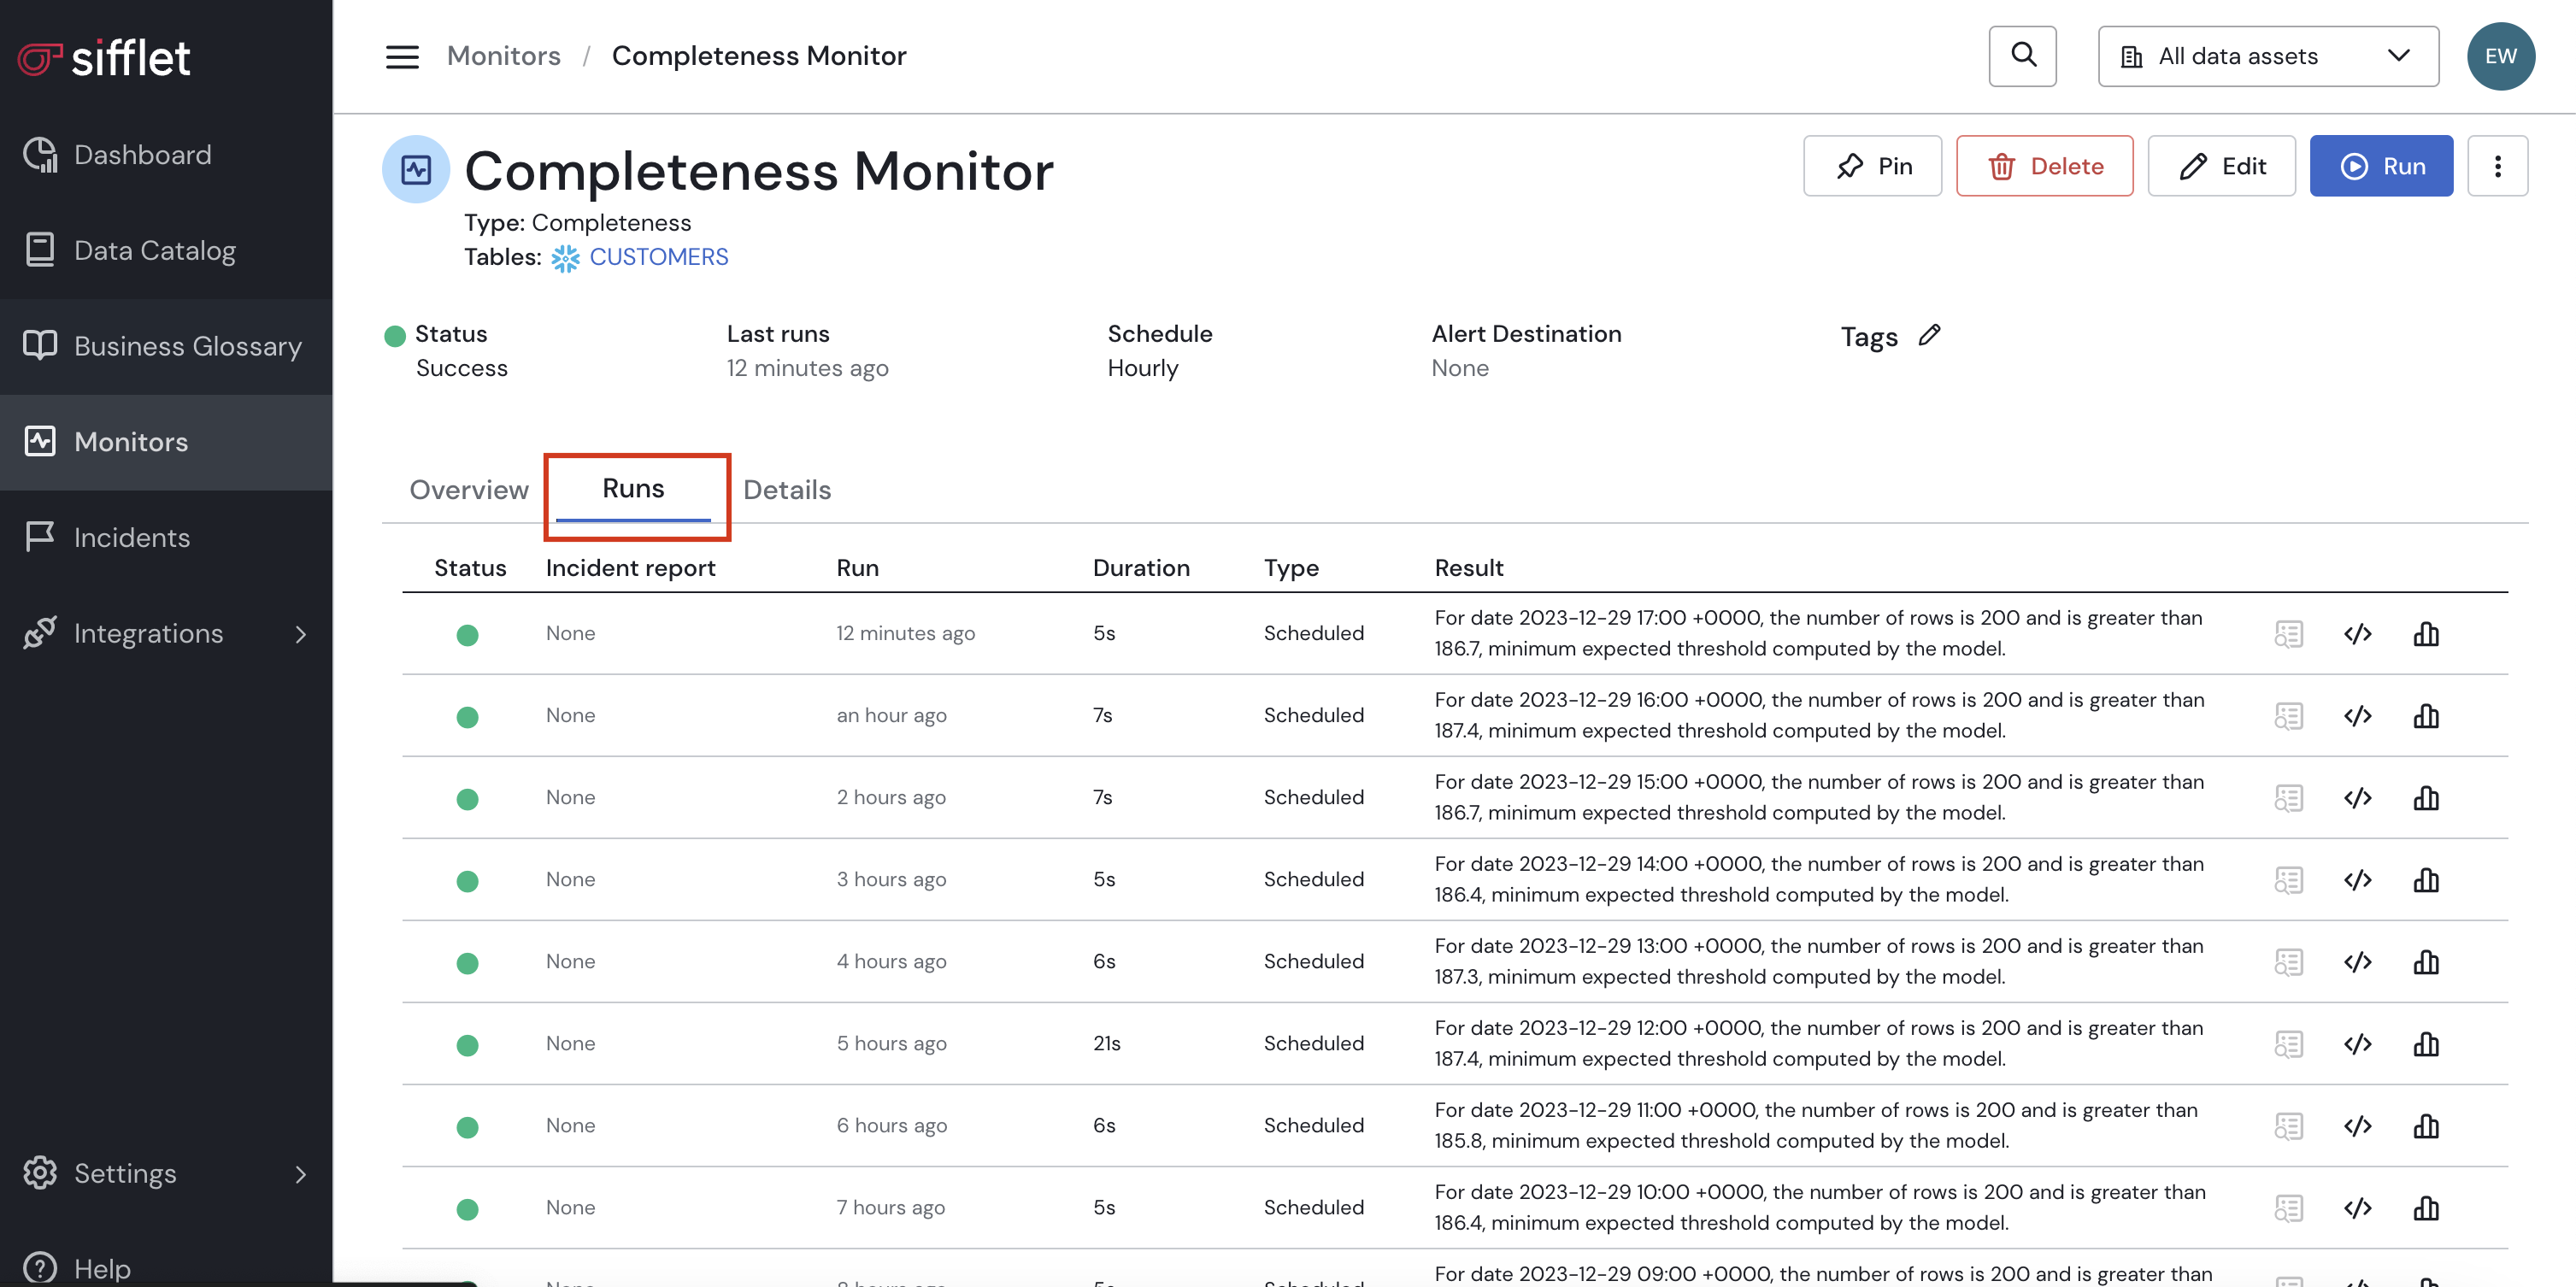
Each Monitor Run ends with a display of its results that can be accessed on the Monitor Details Page in the Runs Tab.
How to
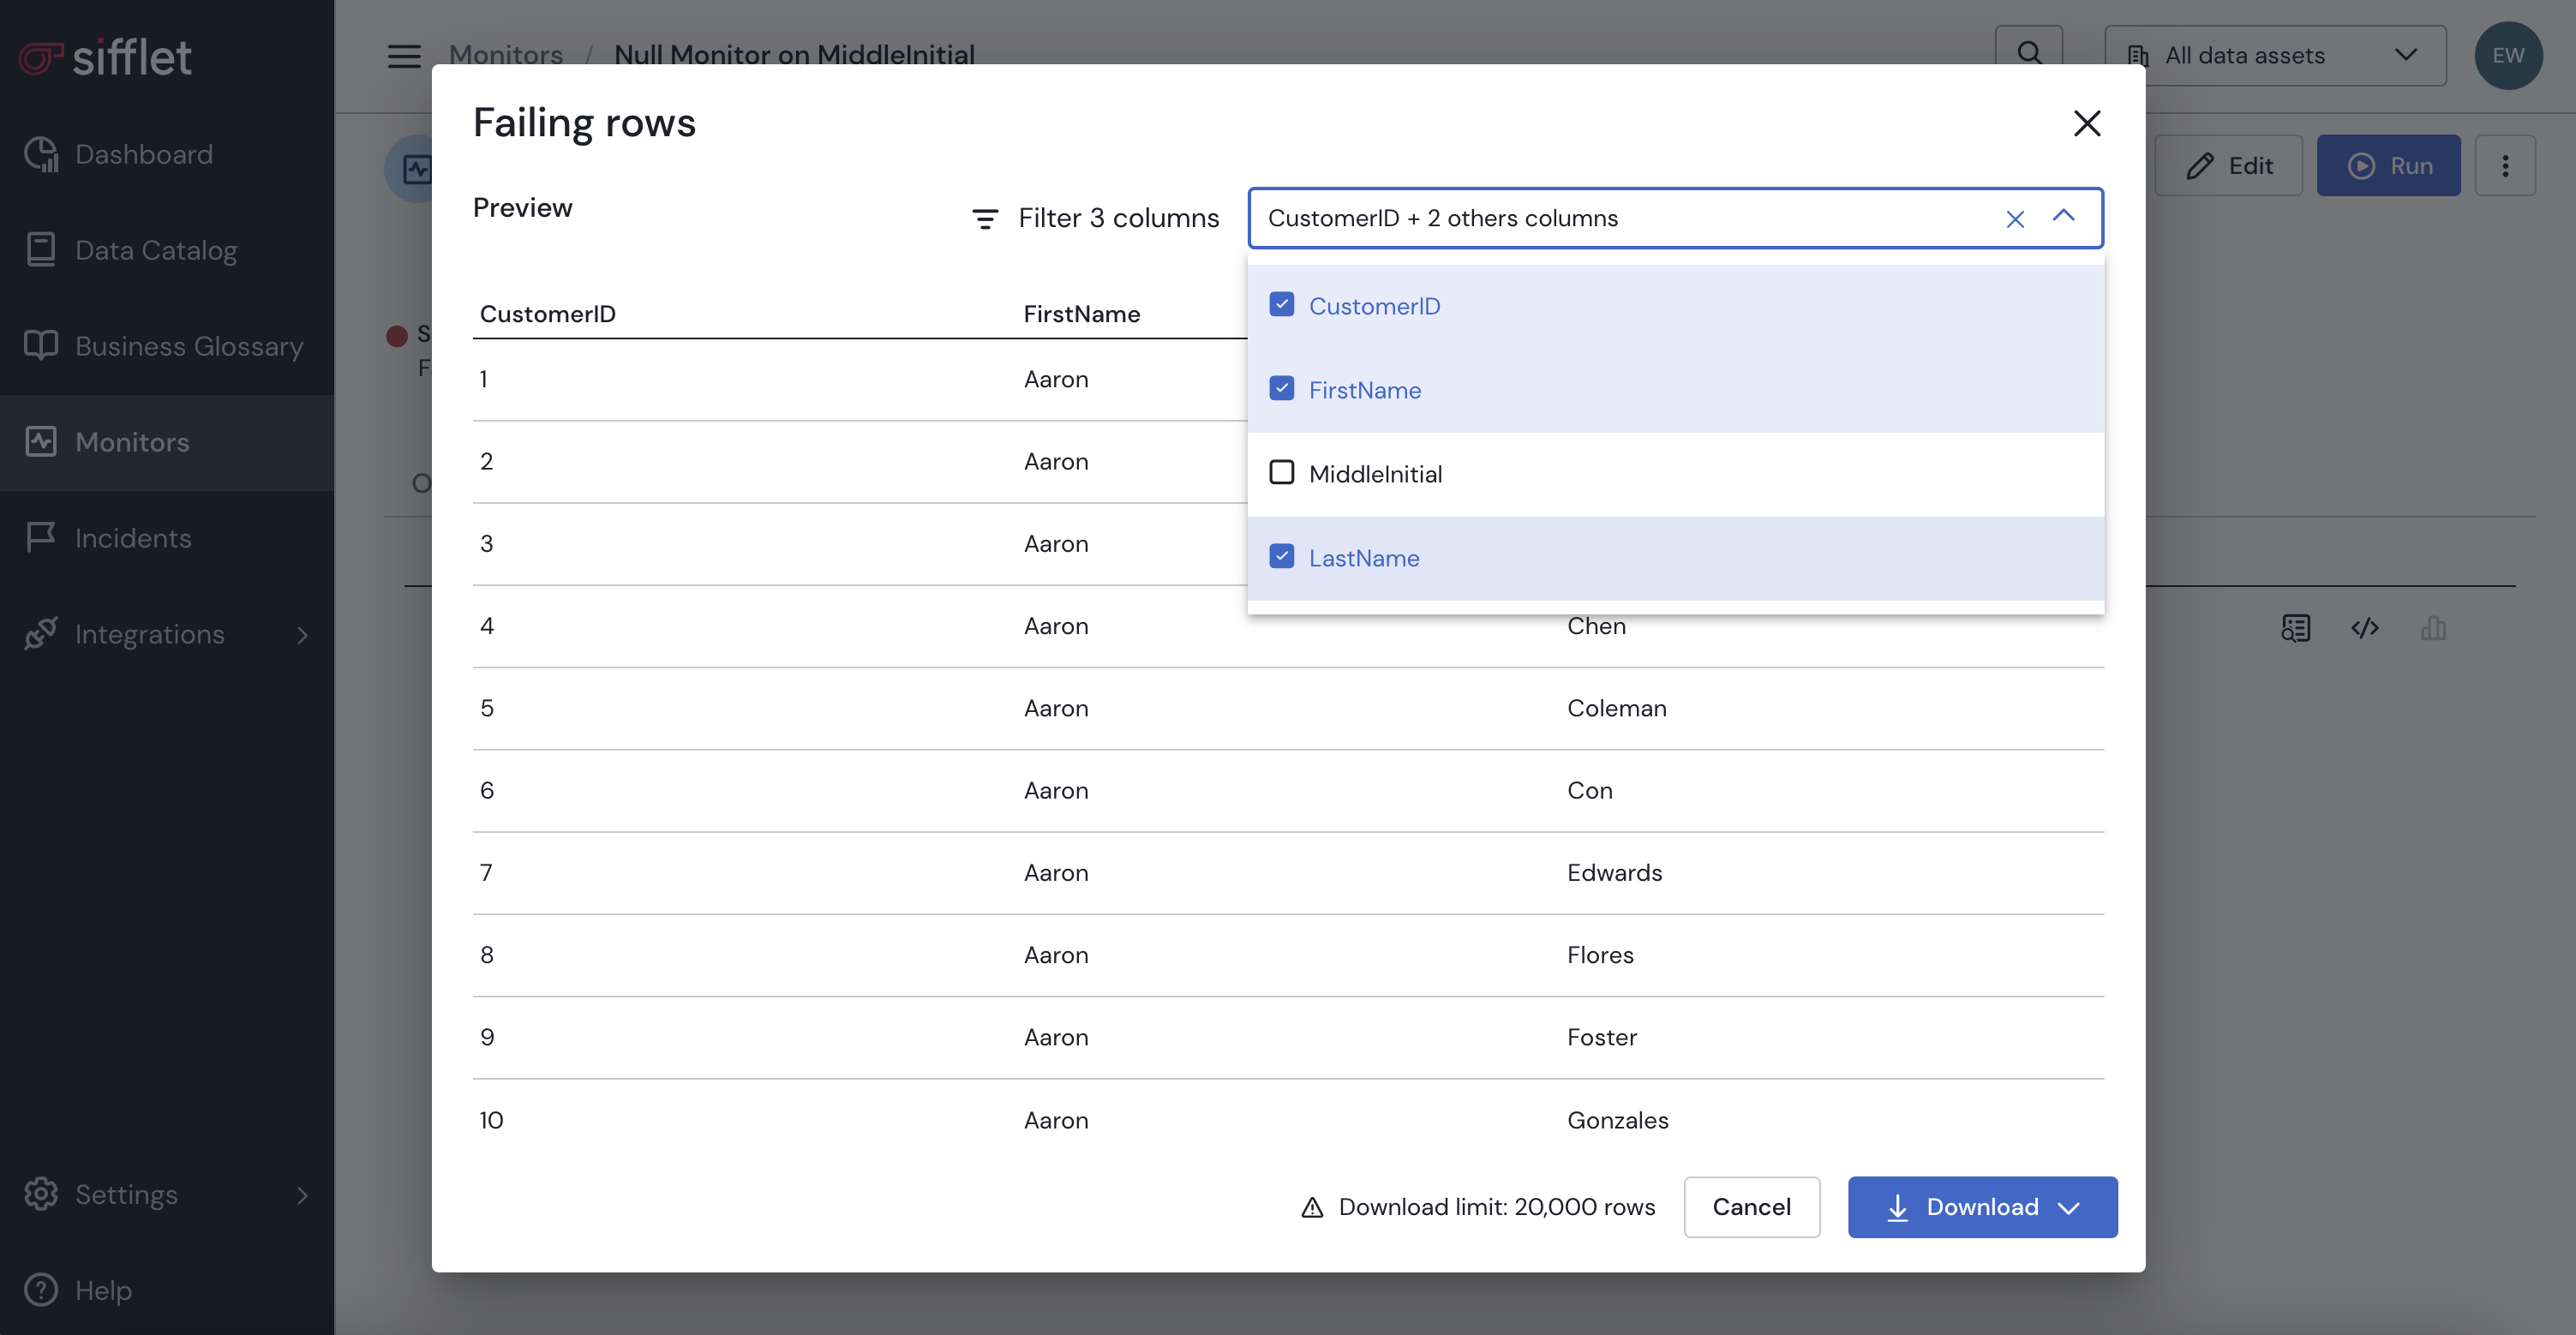
In case a Monitor fails (detects anomalies), it's possible to preview the rows that didn't meet Monitor criteria using a functionality called Failing Rows. Additionally, for ML-based Monitors, it's also possible to display results on graphs.
Failing Rows
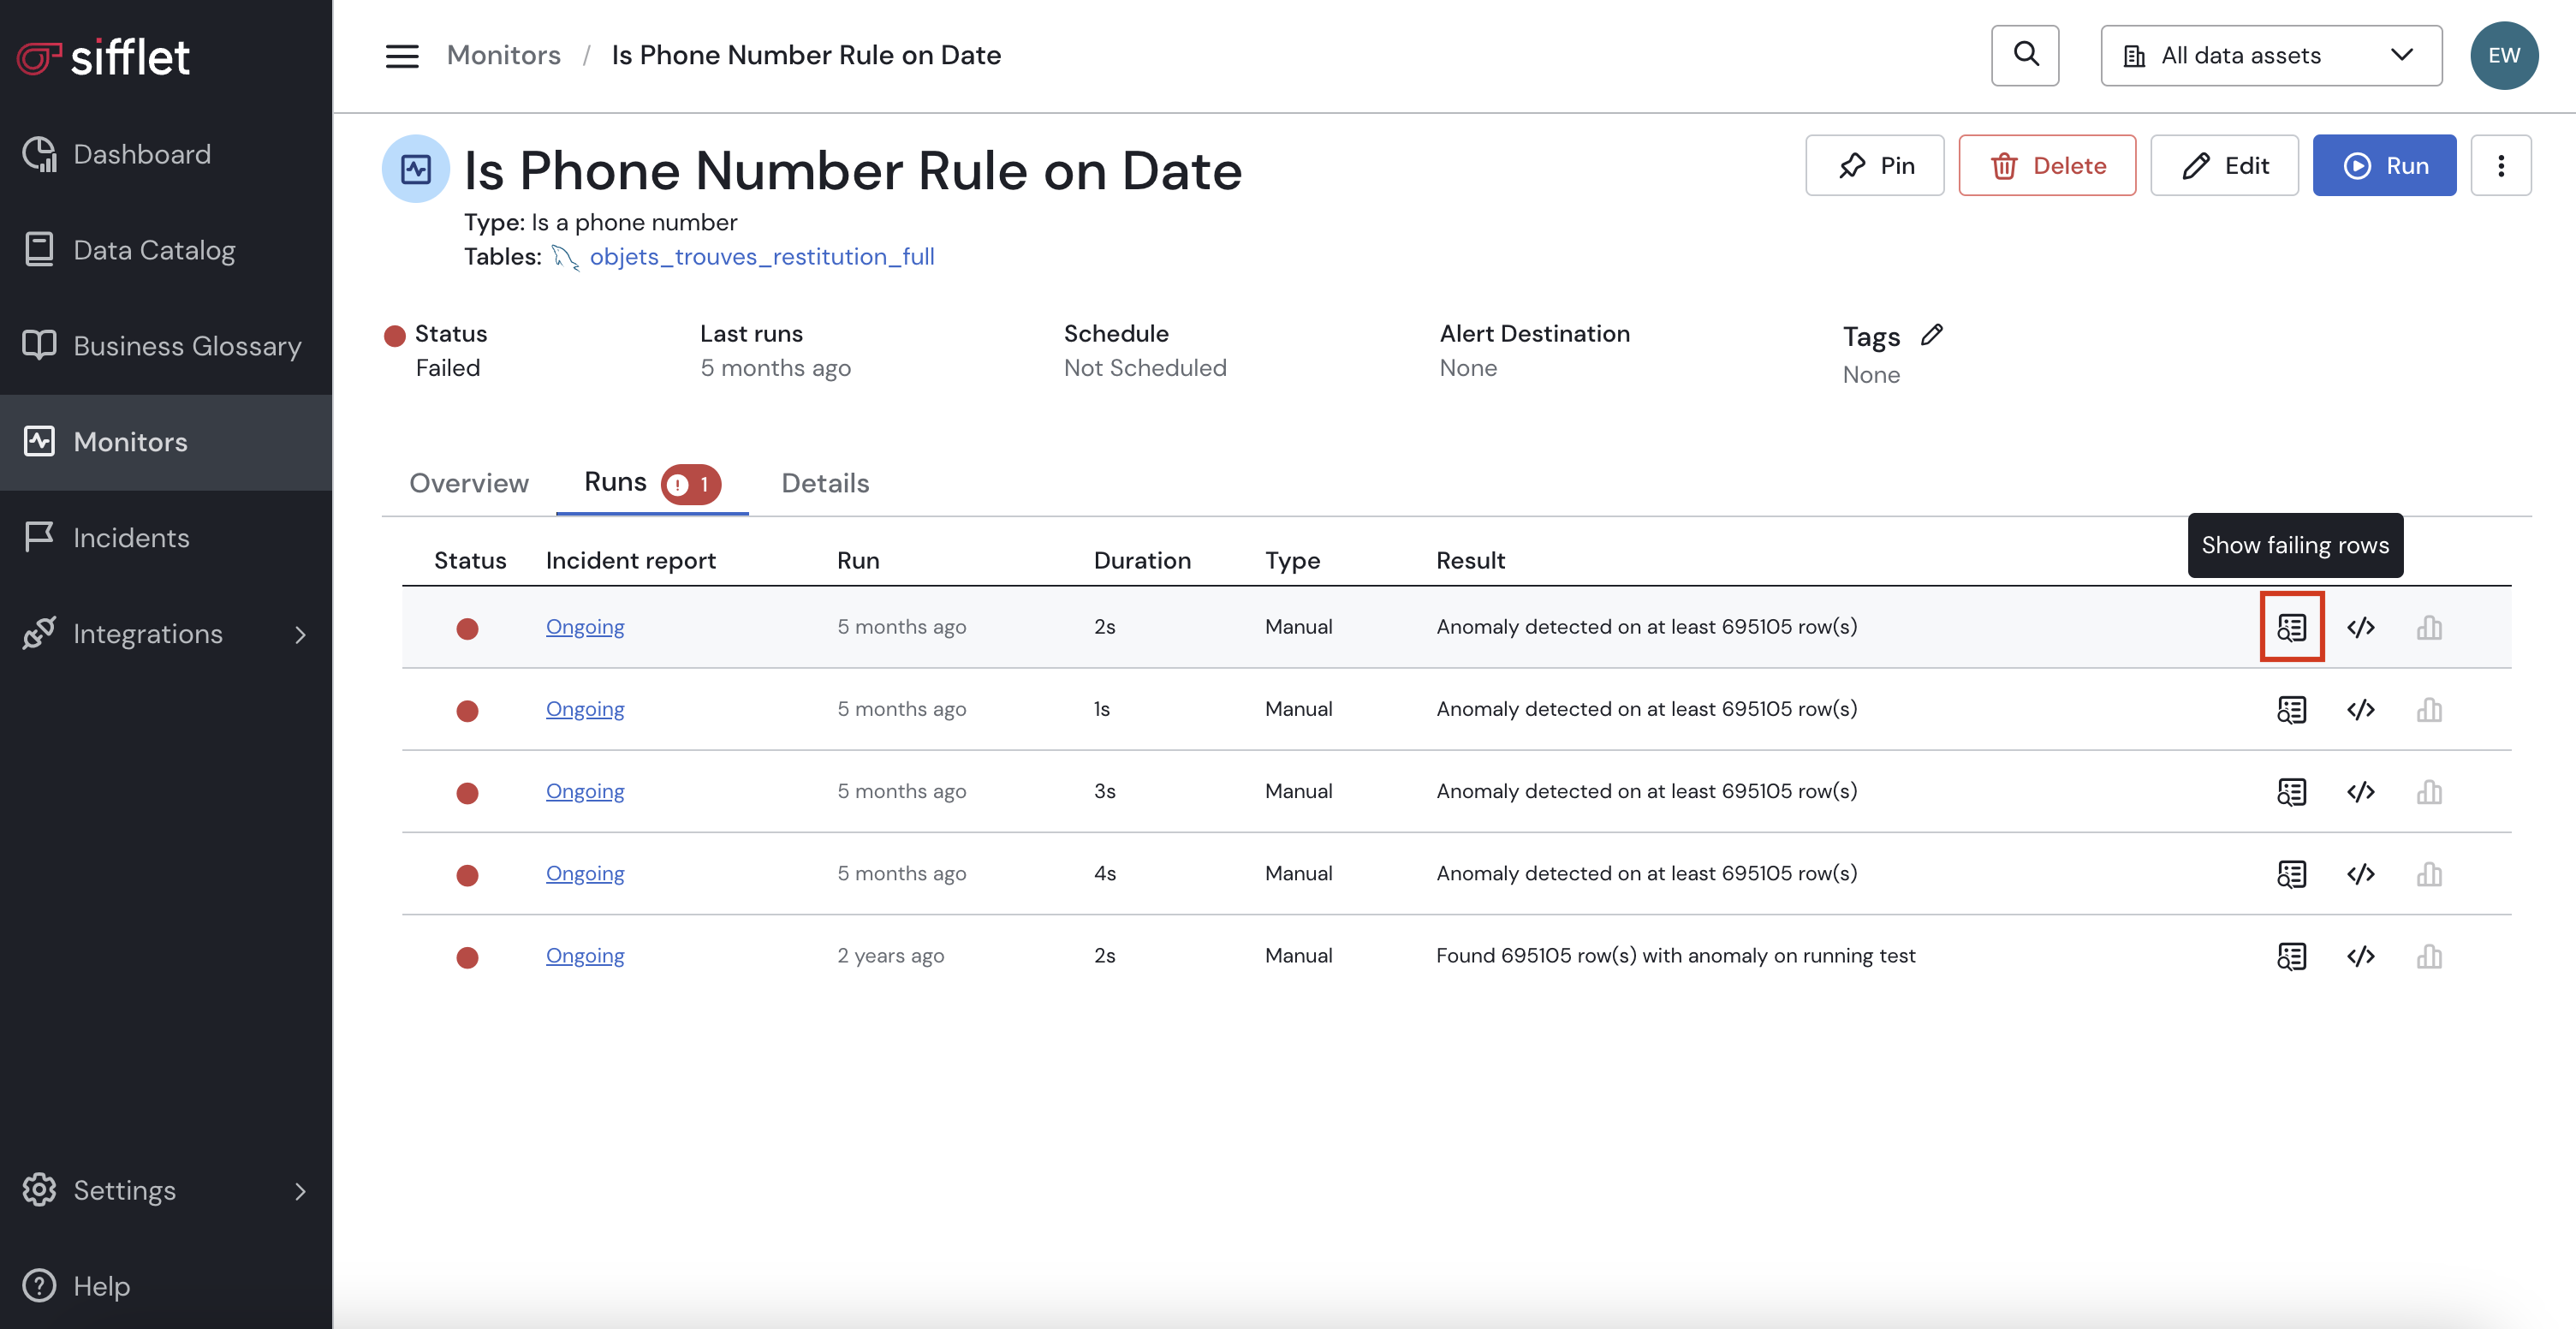
For all monitors detecting anomalies on specified rows (for example Format Validation), it's possible to see a preview of Failing Rows. In order to display the compromised rows, click the Show failing rows button in the Runs Tab.
Graphs
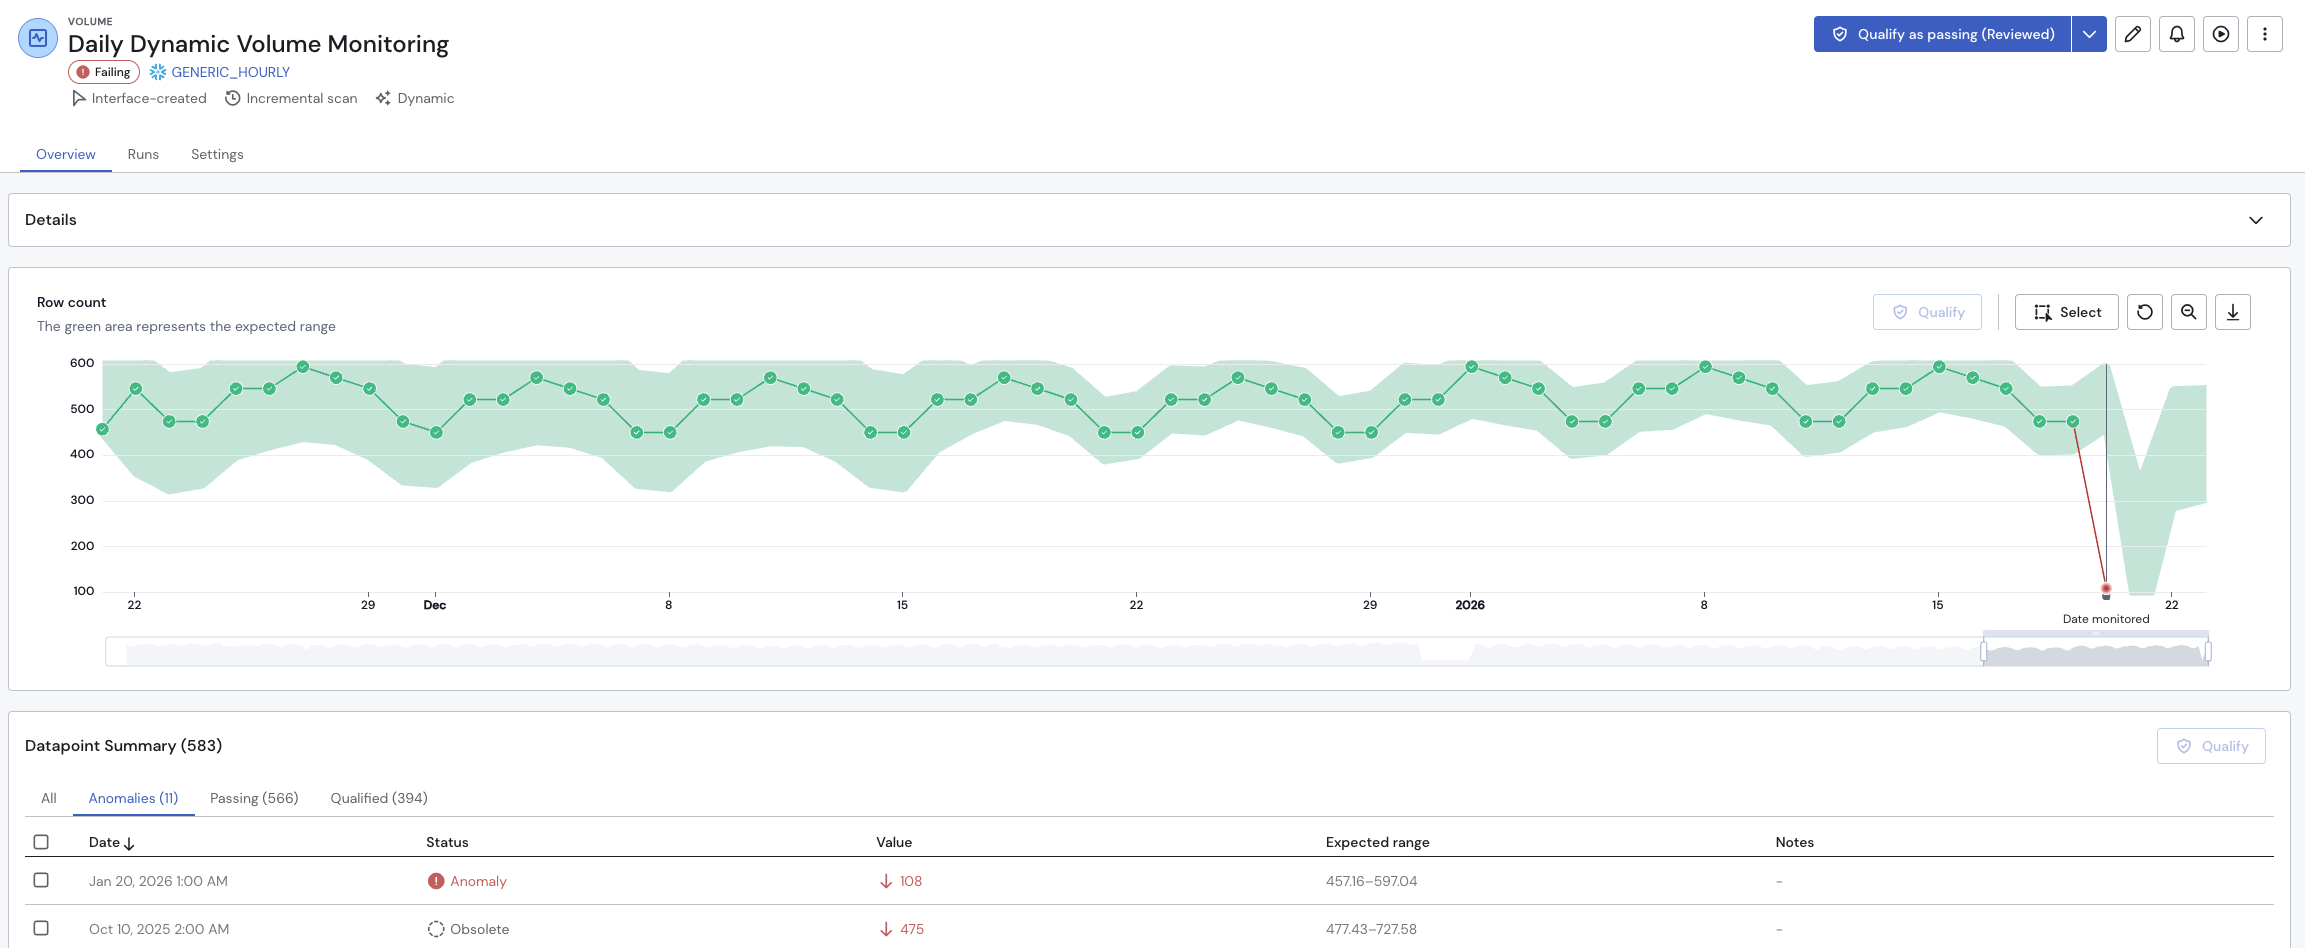
For ML-based rules, results can be analyzed with graphs. Those are displayed both in the Overview section of a monitor for the last run and in the Runs section for a deep dive on a specific past execution. To get those graphs, click the Show details icon on any line.
Analysis
- Green area - Confidence Band computed my the ML model represents the expectations for the behavior of data.
- Green dotted curve - Actual behavior of data.
- Red dots - anomalies, when the black curve is outside of the confidence band.
Updated 5 months ago