Monitor Template Selection Guidelines
This page helps you choose the right monitor template for your use cases.
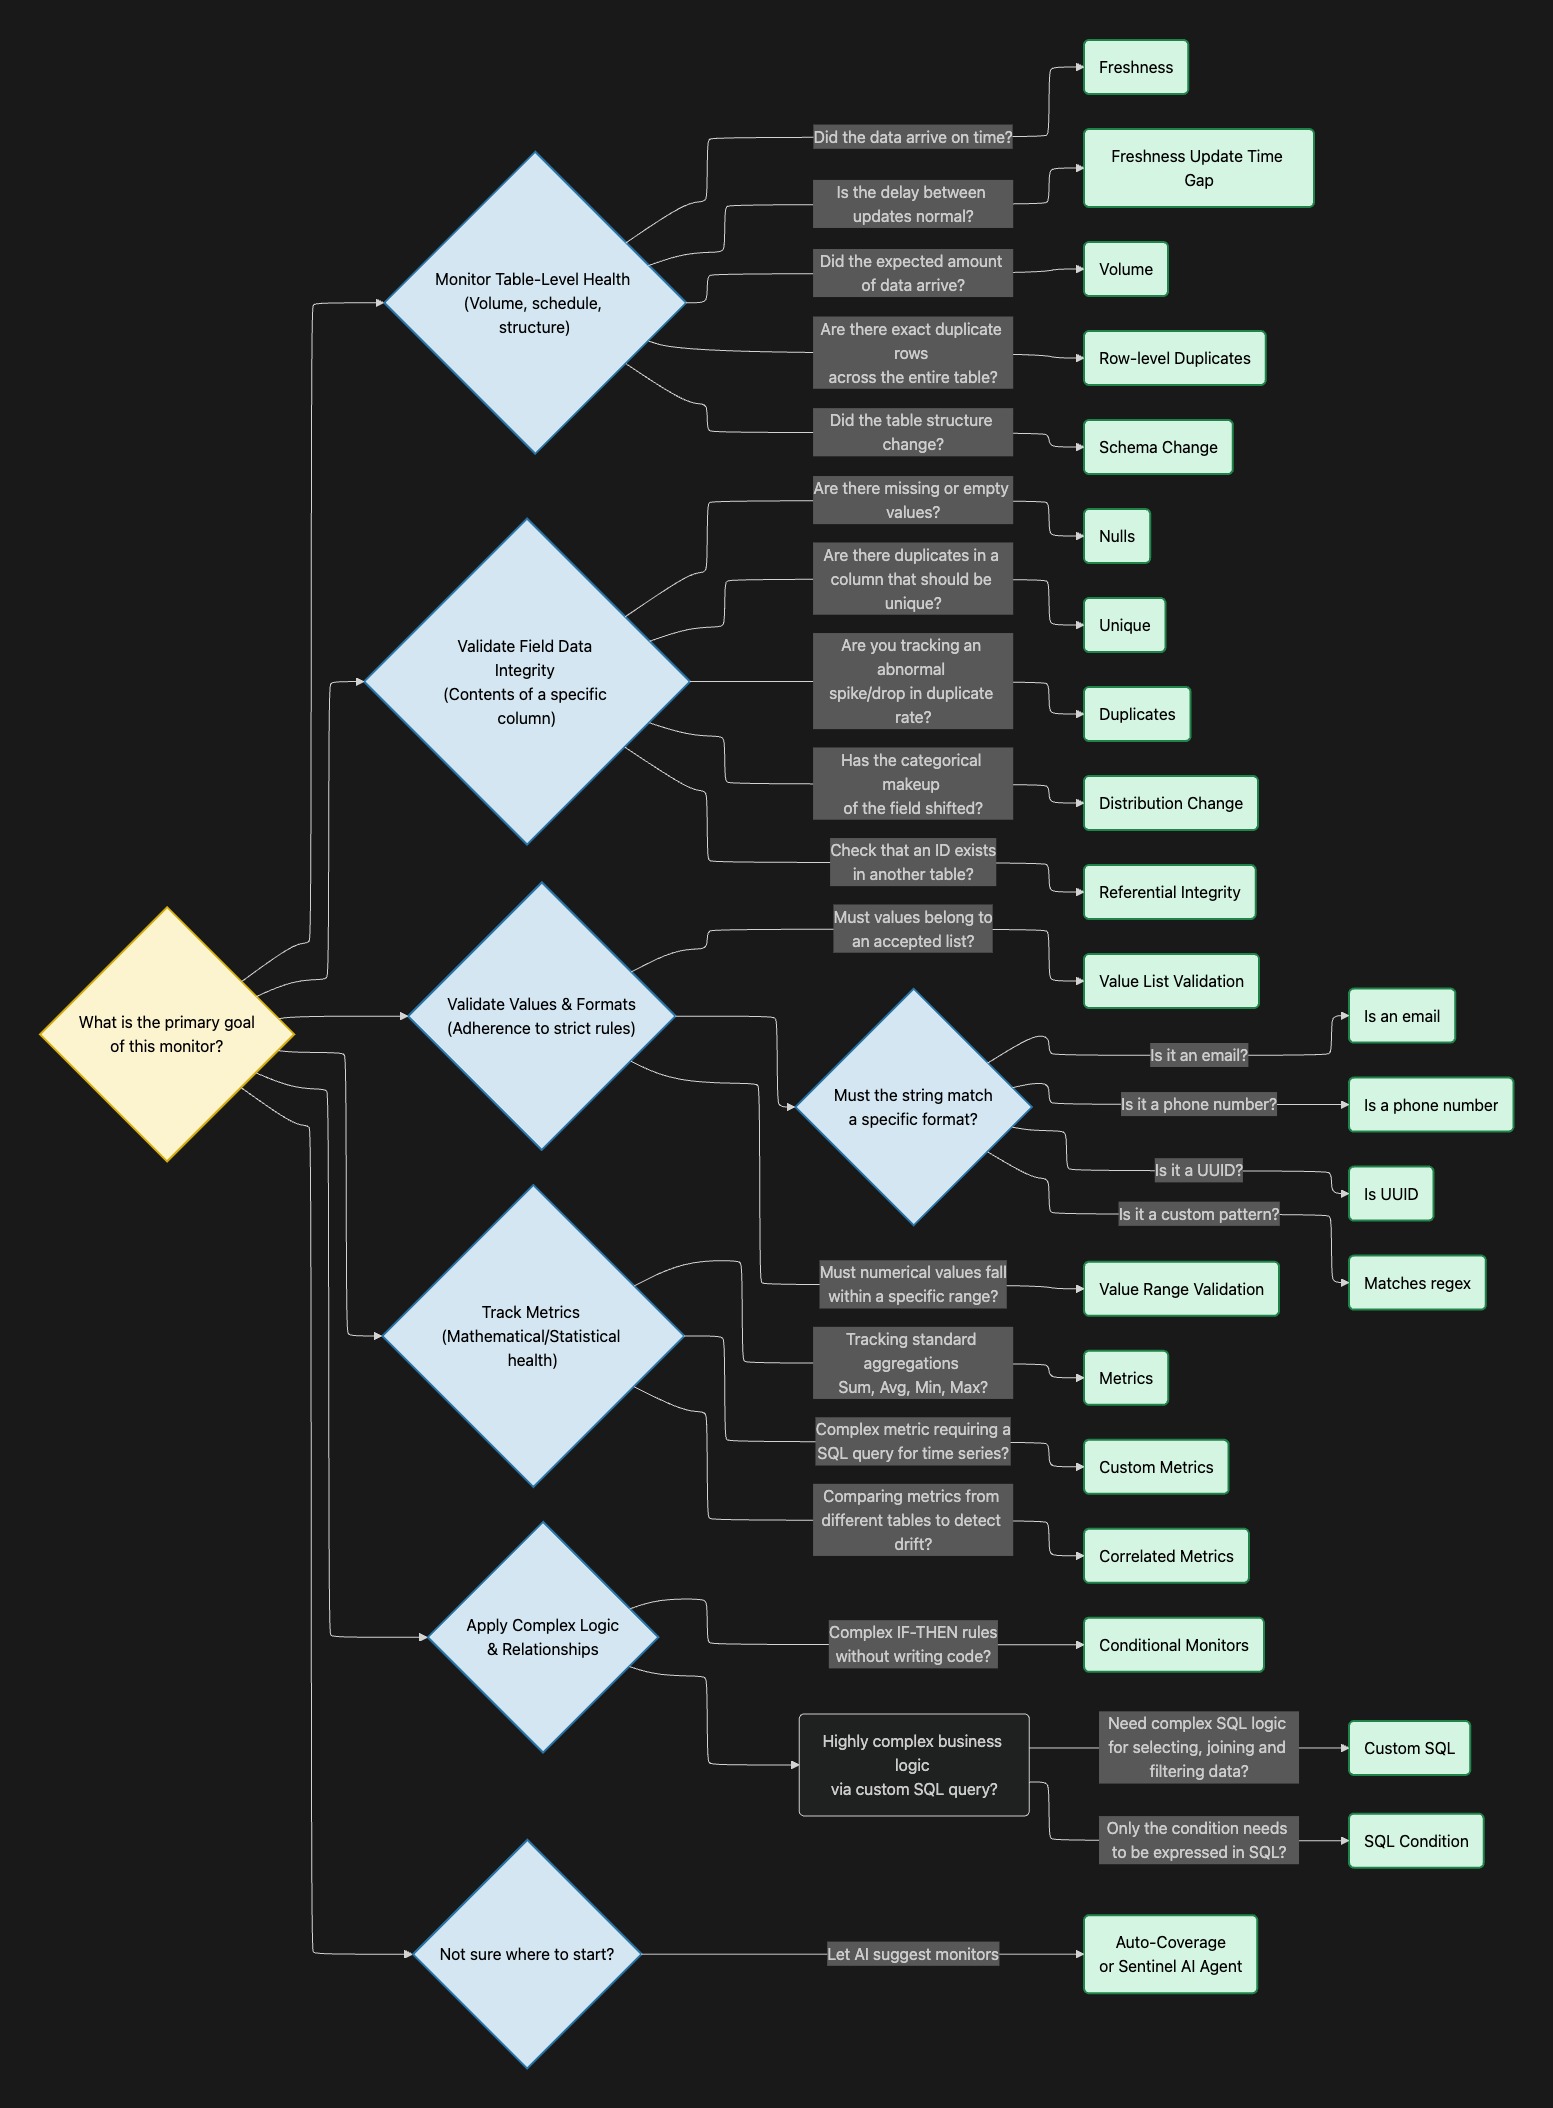
🎯 Choosing the right monitor template
1. Table-Level Health (Pipeline Reliability)
Choose these monitors when your primary concern is ensuring that data is arriving on time, in the expected quantities, and without structural breaking changes.
- Use Case: You need to know if a daily ETL job failed to run or ran late.
- Template: Freshness or Freshness (Update Time Gap). Freshness verifies if new rows are ingested following an expected pattern, while the Update Time Gap monitor fails if the duration since the last data update deviates from historical norms.
- Use Case: You want to ensure you aren't suddenly missing half your data (e.g., a drop in daily orders) or receiving a massive unexpected spike in records.
- Template: Volume. This monitors the number of ingested data rows and alerts you to anomalous behavior compared to past trends or static thresholds.
- Use Case: You want to prevent downstream dashboards from breaking because an upstream engineering team renamed or dropped a column.
- Template: Schema Change. It detects any changes to the table's structure, including new fields, removed fields, or updated data types and names.
- Use Case: You want to catch pipeline errors that cause every single row to be loaded twice.
- Template: Row-level Duplicates. This computes the duplication rate at a row level and compares it to expected past behavior.
2. Field Profiling (Data Integrity)
Choose these monitors when you need to ensure the completeness and uniqueness of specific columns, or validate relationships between tables.
- Use Case: You need to ensure that a primary key (like
customer_idororder_id) is never duplicated or missing.- Template: Unique (fails if the column is not strictly unique) or Duplicates (detects anomalies in the count of duplicates). Use Nulls to detect anomalies regarding the count of missing or empty values.
- Use Case: You need to verify that foreign keys correctly map to dimension tables (e.g., every
customer_idin yourORDERStable must exist in yourCUSTOMERStable).- Template: Referential Integrity. This ensures that values in one table match the valid values of another.
- Use Case: You want to ensure a column's statistical distribution hasn't heavily skewed (e.g., detecting if a specific product category suddenly dominates your sales data due to a tracking error).
- Template: Distribution Change. This fails if the distribution of categories within a field changes abnormally compared to a previous run or a fixed reference date.
3. Value & Format Validation (Data Accuracy)
Choose these monitors when specific fields must adhere to strict business rules, formats, or ranges.
- Use Case: You need to ensure a status column only contains accepted business values (e.g., "Pending", "Shipped", "Delivered").
- Template: Value List Validation. This fails if the chosen string field has values that are not present in your predefined list.
- Use Case: You need to ensure numeric values are in a specific range (e.g., an
item_pricemight only be between0and999).- Template: Value Range Validation. This fails if a numeric field contains values outside of a specified minimum and maximum range.
- Use Case: You are collecting PII or standard identifiers and need to ensure they are properly formatted.
- Template: Format Validation. Sifflet provides ready-to-use templates for Is an email, Is a phone number, and Is UUID. For custom patterns (e.g., custom order IDs like
ORD-123), use the Matches regex template.
- Template: Format Validation. Sifflet provides ready-to-use templates for Is an email, Is a phone number, and Is UUID. For custom patterns (e.g., custom order IDs like
4. Metrics & Statistical Health
Choose these monitors to track the actual business metrics inside your data (like sums, averages, and maximums).
-
Use Case: You want to track the total daily revenue or the average order value and be alerted if it drops unexpectedly.
- Template: Metrics. This template applies statistical operations (Sum, Average, Min, Max, Variance, Standard Deviation, Distinct Count) to numeric fields and detects anomalies dynamically or via static boundaries.
ℹ️ Choose the aggregation method that makes sense to your use case. For example, the SUM oforder_totalmight fluctuate a lot based on shoppers patterns while the average value should be more predictable.
- Template: Metrics. This template applies statistical operations (Sum, Average, Min, Max, Variance, Standard Deviation, Distinct Count) to numeric fields and detects anomalies dynamically or via static boundaries.
-
Use Case: You need to monitor a complex metric that requires a custom SQL query, or a metric computed in a semantic layer.
- Template: Custom Metrics. This allows you to write a SQL query that returns a metric value over time, allowing Sifflet's ML models to learn its behavior and alert on deviations.
ℹ️ Note that could also use a custom aggregation within the Metrics template. This allows to use SQL code but only for the aggregation function.
- Template: Custom Metrics. This allows you to write a SQL query that returns a metric value over time, allowing Sifflet's ML models to learn its behavior and alert on deviations.
-
Use Case: You want to ensure that total sales reported in your application database matches the total sales reported in your financial data warehouse.
- Template: Correlated Metrics. This monitors two or more metrics and fails if they diverge significantly from one another.
5. Complex Business Logic
Choose these when your data quality rules require cross-column dependencies or complex logic.
- Use Case: You want to build complex
IF-THENvalidation rules without writing any code (e.g., "Ifstatusis 'Shipped', thenshipped_atcannot be NULL").- Template: Conditional Monitors. This provides a visual, no-code interface to build rules with multiple conditions. It alerts you if any rows match the "bad data" conditions you define.
- Use Case: You have highly complex, multi-step business logic that can only be expressed through advanced SQL.
- Template: Custom SQL. This allows you to write an advanced query describing a quality breach. The rule fails if the query returns any rows (row count > 0).
- Use Case: You have complex condition that you can only express in SQL but you want to benefit from Sifflet’s management of time aggregations, joins, where clause etc.
- Template: SQL Condition. This allows you to write an advanced condition for selecting rows in your table. The rule fails if the query returns any rows matching the SQL condition (row count > 0).
A note on AI Assistance: If you are unsure where to start, you can use Auto-Coverage or the Sentinel AI Agent. By analyzing your table's schema, metadata, and column names, the AI will automatically suggest the most relevant monitors (such as completeness, uniqueness, and validity checks) for your specific dataset
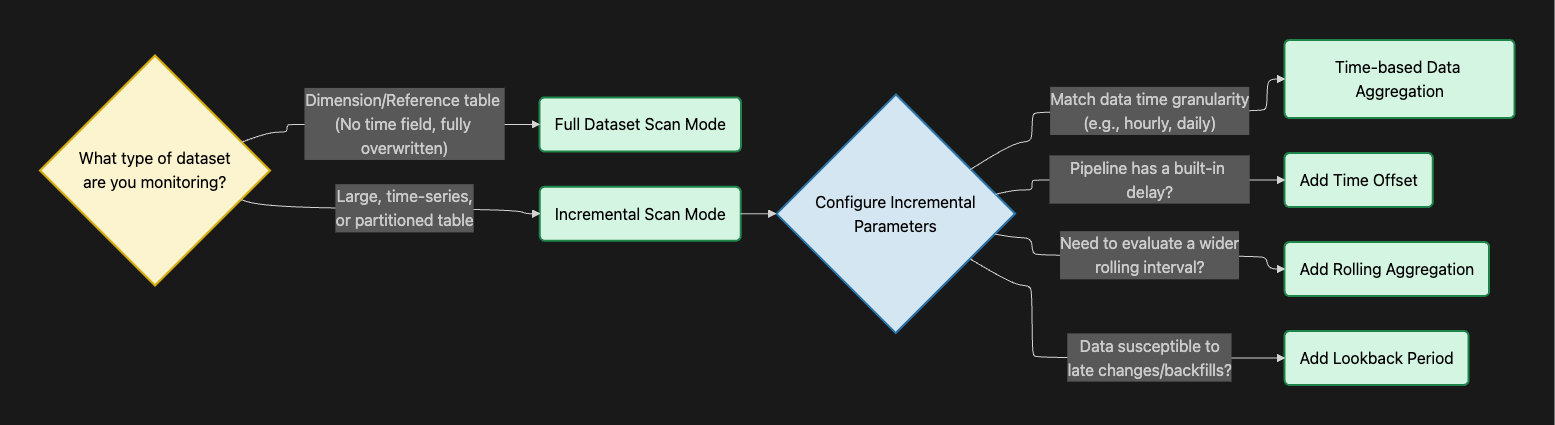
⏱️ Choosing the Right Scan Mode & Time Windows
The scan mode dictates how much of your table Sifflet analyzes during each run.
1. Full Dataset Scan Mode
- When to use: Use this mode when you want the monitor to scan the entire table at every run.
- Best for: Dimension tables, mapping tables, or reference datasets that do not have a time field or are completely overwritten during each pipeline run.
2. Incremental Scan Mode
-
When to use: Use this mode for large, time-series, or partitioned tables where you only want to scan new or updated data. This requires selecting a time field (or letting Sifflet auto-detect the partition key),.
-
How to configure the parameters:
- Time-based Data Aggregation: Choose the frequency of the data points you want to check (e.g., hourly, daily, weekly),. Match this to your data's time granularity. If your data represents a daily metric, running an hourly aggregation is suboptimal.
- Time Offset: Choose this if your pipeline has a known, built-in delay (e.g., a table that updates every morning with data from 2 days ago). Adding a 2-day offset shifts the evaluation window into the past, ensuring Sifflet doesn't falsely alert you on "empty" current days,.
- Rolling Aggregation: Choose this if a single data point needs to represent a wider time interval rather than a single bucket. For example, you can set a daily data point to represent the rolling sum of the last 7 days. This is particulary beneficial if your data does not follow a regular pattern but the moving average is more stable.
- Lookback Period: Choose this if your historical data is susceptible to late changes or backfills. It tells Sifflet to look back over a specified time window (e.g., the last 3 days) and re-check previous data points for newly introduced anomalies.
Note that the frequency of the monitor schedule (WHEN it runs) is independent from the time window settings.
- If you run a monitor daily (schedule = daily) but with an hourly time aggregation, that means that every day Sifflet will retrieve 24 datapoints for each hour of the previous day.
- On the other hand, running a monitor hourly with a daily aggregation will keep retrieve the data for the same day every hour. This can makes sense if you are tracking updates to the data based on a creation date for instance.
- Ideally, try to align the schedule frequency with the time aggregation. This will make the understanding of the datapoints much easier.
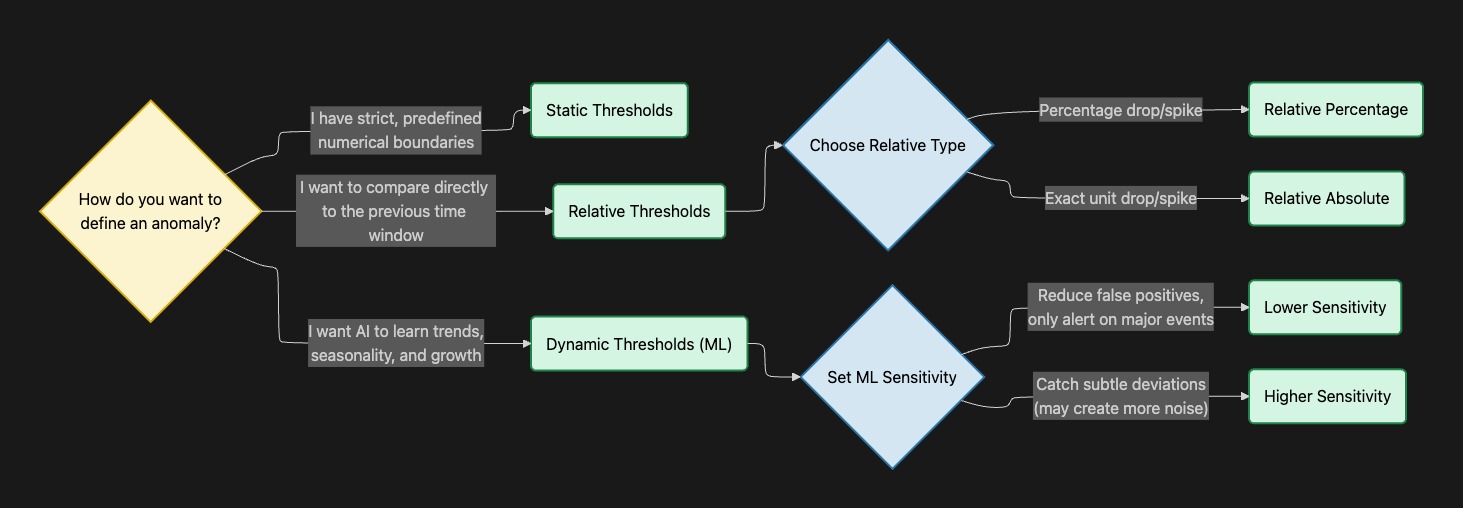
🎛️ Choosing the Right Threshold ModeThe threshold mode determines the logic Sifflet uses to decide whether a data point is "normal" or an "anomaly".
1. Dynamic Thresholds (Machine Learning)
- How it works: Sifflet uses machine learning models to learn from your historical data, automatically adjusting expectations based on growth and seasonality.
- When to use: Choose this when you don't have specific hard limits but want to catch abnormal behavior, sudden drops, or unexpected spikes.
- Key Setting - Sensitivity: You must define how aggressive the ML model should be. Lower sensitivity reduces false positives and alerts only on significant events, while Higher sensitivity catches subtle deviations but may create more noise.
2. Static Thresholds (Fixed Limits)
- How it works: You define strict, predefined numerical boundaries (a minimum, a maximum, or both),.
- When to use: Choose this for known business cases and strict rules. For example, if you know a product price can never be negative, you set a static minimum threshold of 0. This is also perfect for Freshness SLOs. If your data contract stipulate that your table must be refreshed by 9am every day, then define a Freshness monitor running at 9am with a threshold of 24h.
3. Relative Thresholds
- How it works: Instead of looking at the absolute number or long-term seasonality, this compares the current data point directly to the previous time window's value.
- When to use: Choose this when you want to monitor for immediate volatility. You can configure it to alert on a Relative Percentage (e.g., fail if the volume drops by more than 5% compared to yesterday) or a Relative Absolute value (e.g., fail if the row count decreases by exactly 100 units)
Updated 20 days ago