

Operations Dashboard ᴮᴱᵀᴬ
Sifflet is rolling out the Operations Dashboard progressively, so it may not be enabled on your account yet. To request access, contact your Customer Success Manager.
The Operations Dashboard gives you a centralized view of what is happening now, what needs attention, and what is impacted.
It helps answer:
- What is failing?
- What needs my attention?
- Are incidents being handled?
- What is impacted?
The Operations Dashboard focuses on current operational health and rapid resolution rather than historical analysis. Use the Operations Dashboard to investigate issues and take action.
All widgets on the Operations Dashboard reflect the last 30 days of activity. Each widget shows up to 50 results; if more match, only the recent 50 are displayed. Use the dedicated pages (Monitors, Incidents, Data Catalog) to see the full list.
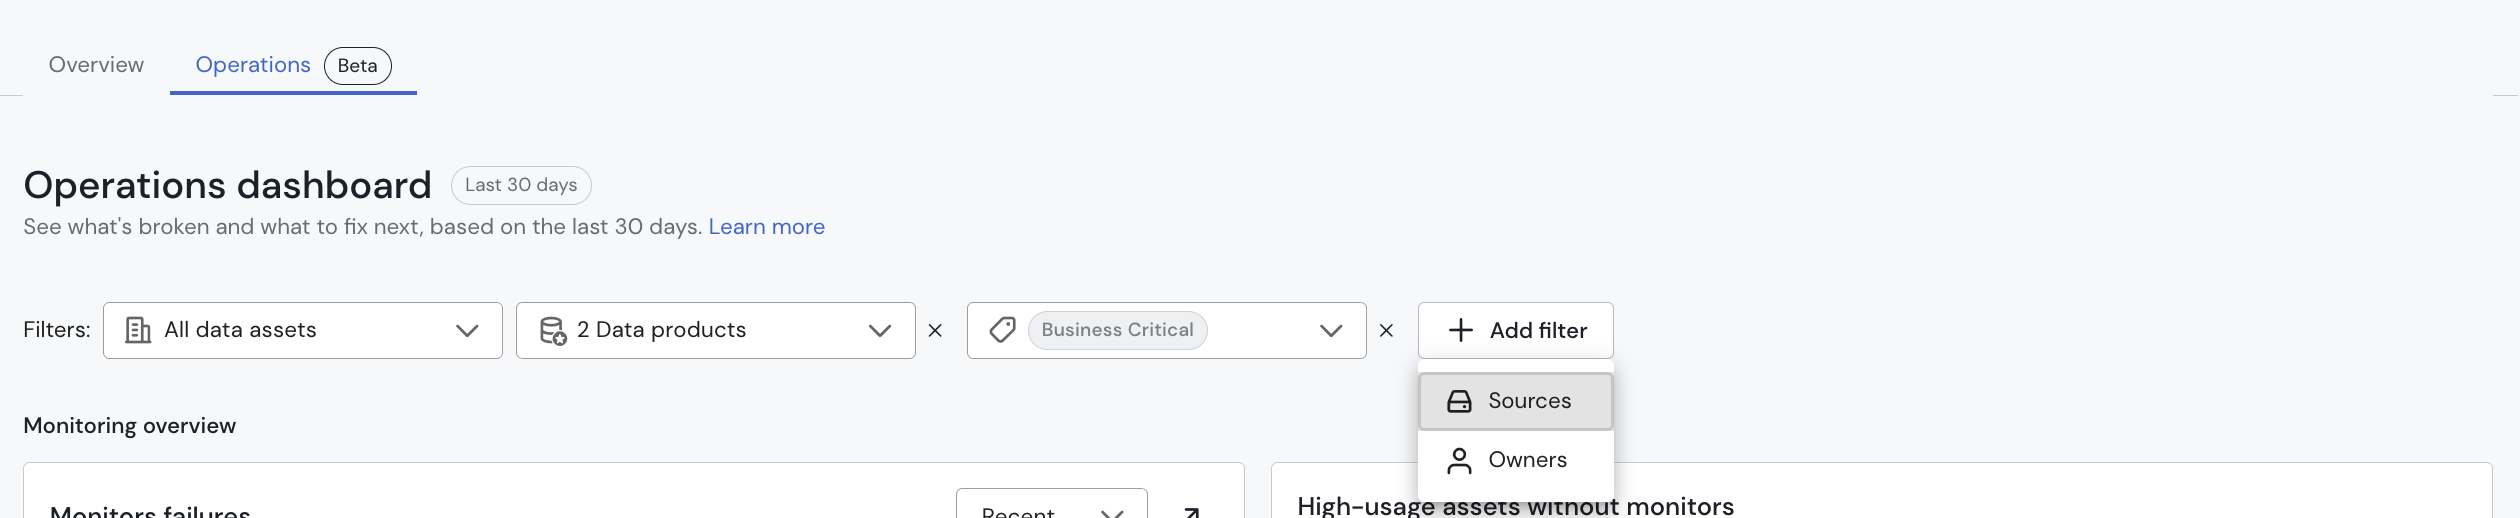
How Filtering Works
All dashboard filters are asset-based: they apply to assets, not to monitors. Dashboards can be filtered by Domain, Data Product, Data Source, Tags, and Owner.
Filters and multiple values can be combined to refine the view. For example, selecting two domains shows their aggregated view, while combining a domain with a tag and data source narrows the results further.
1. What Is Failing?
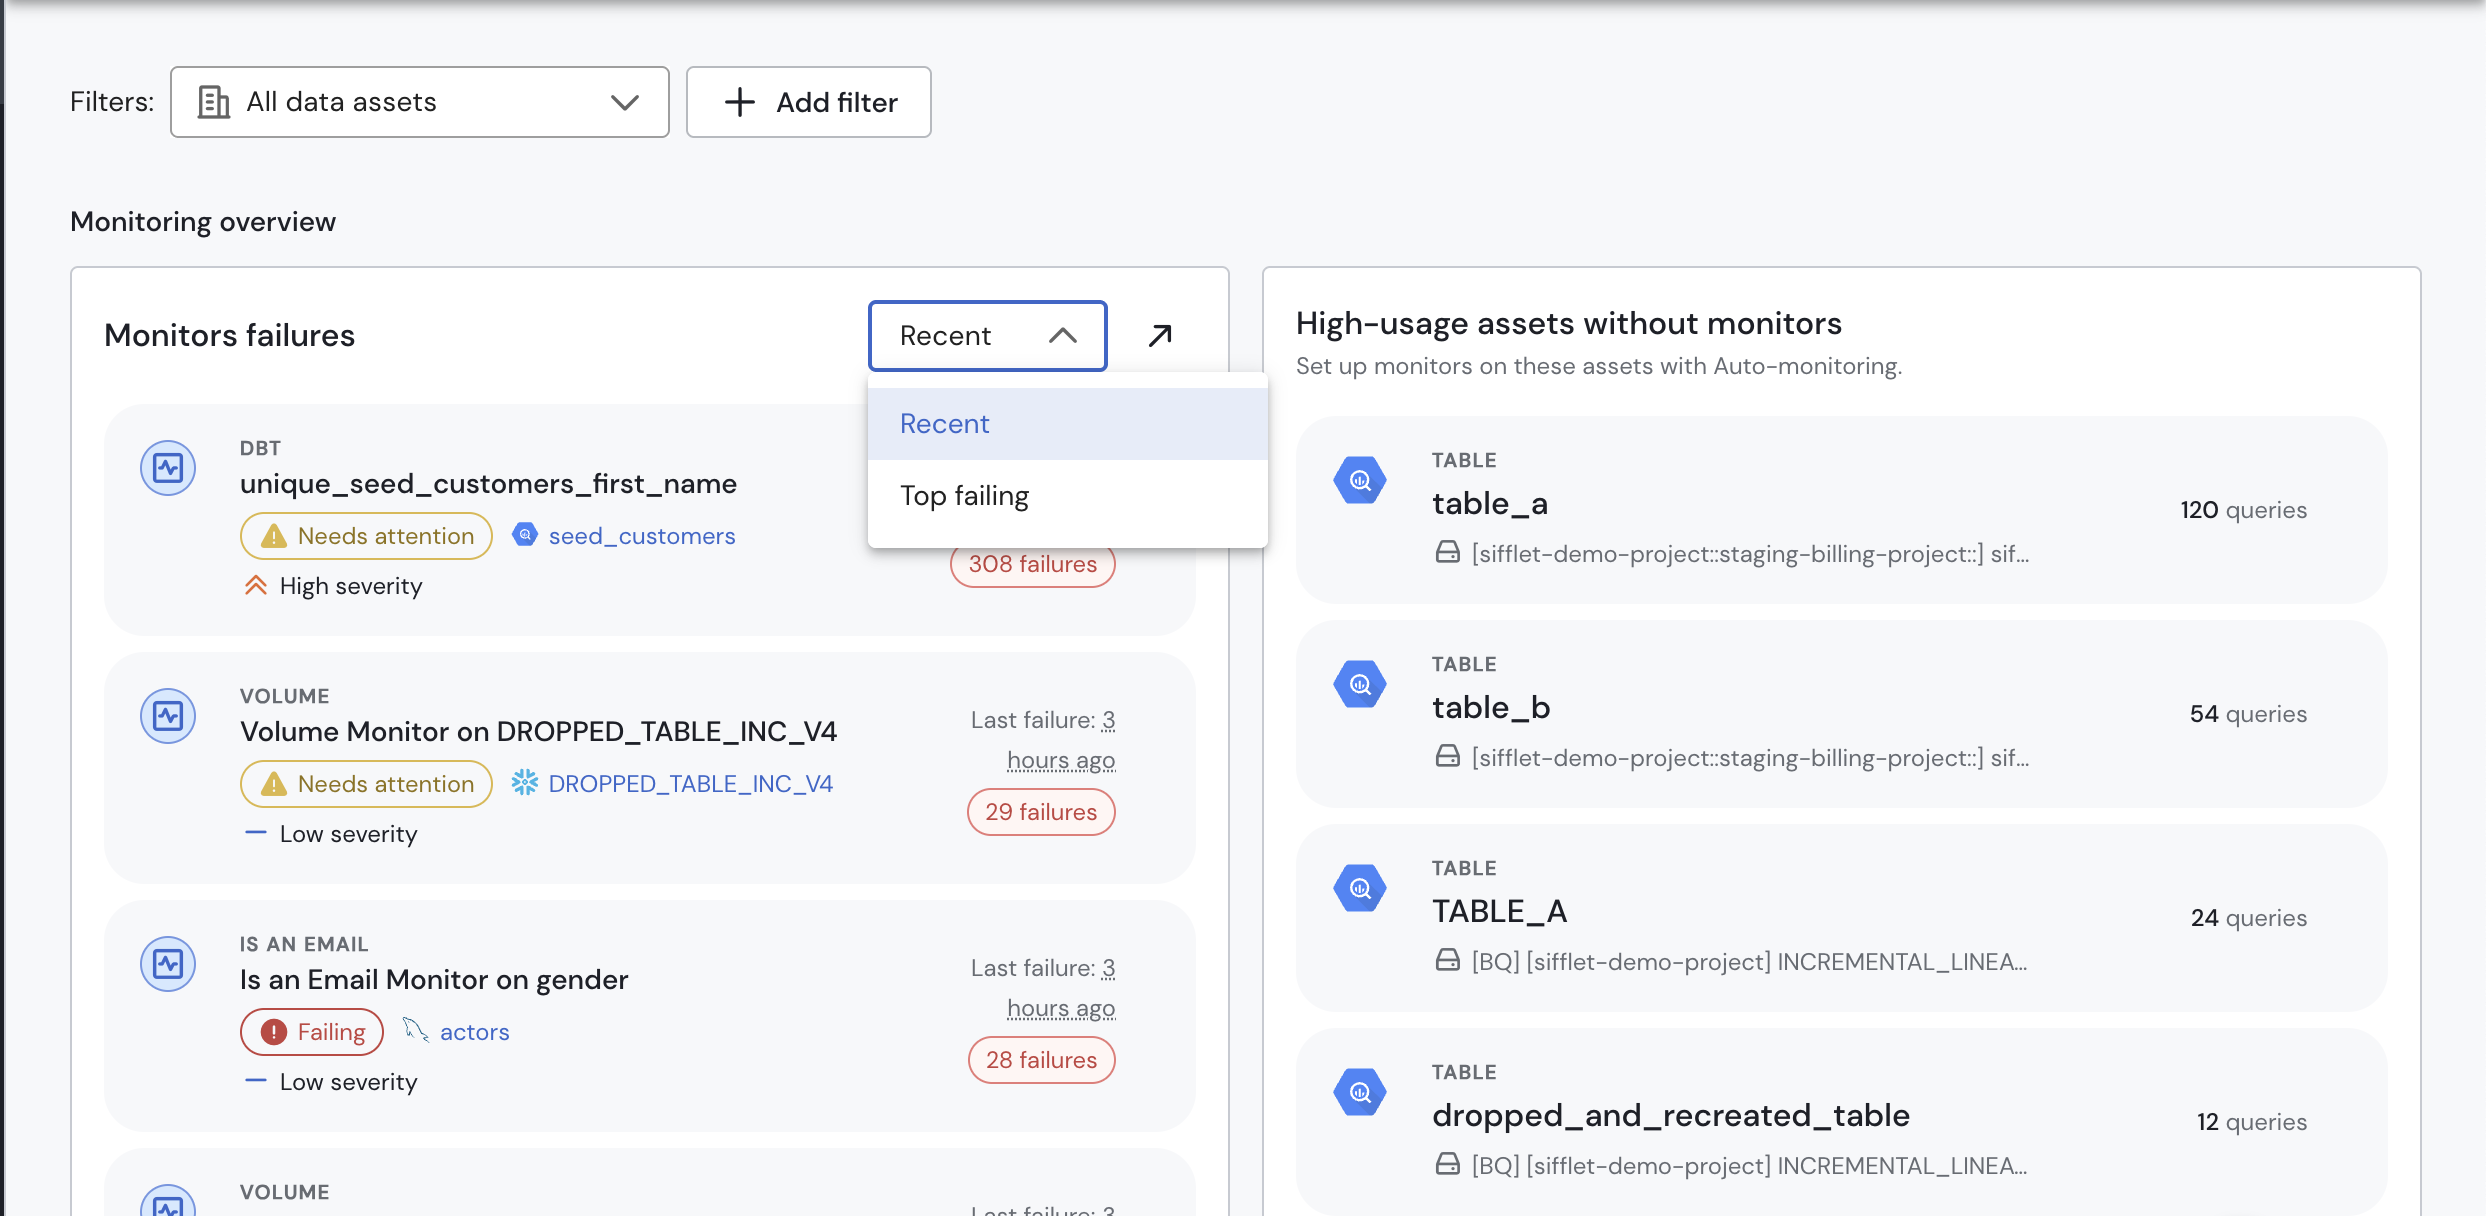
Failing Monitors
Shows both the monitors that fail most frequently and those that failed most recently.
- Top Failing Monitors: Highlights recurring failures that may require investigation or remediation.
- Recent Failing Monitors: Shows the latest failures, giving you a quick view of what is happening now. Recovered monitors are removed from the list.
This provides a quick operational snapshot before going to the full Monitors page.
2. What Needs My Attention?
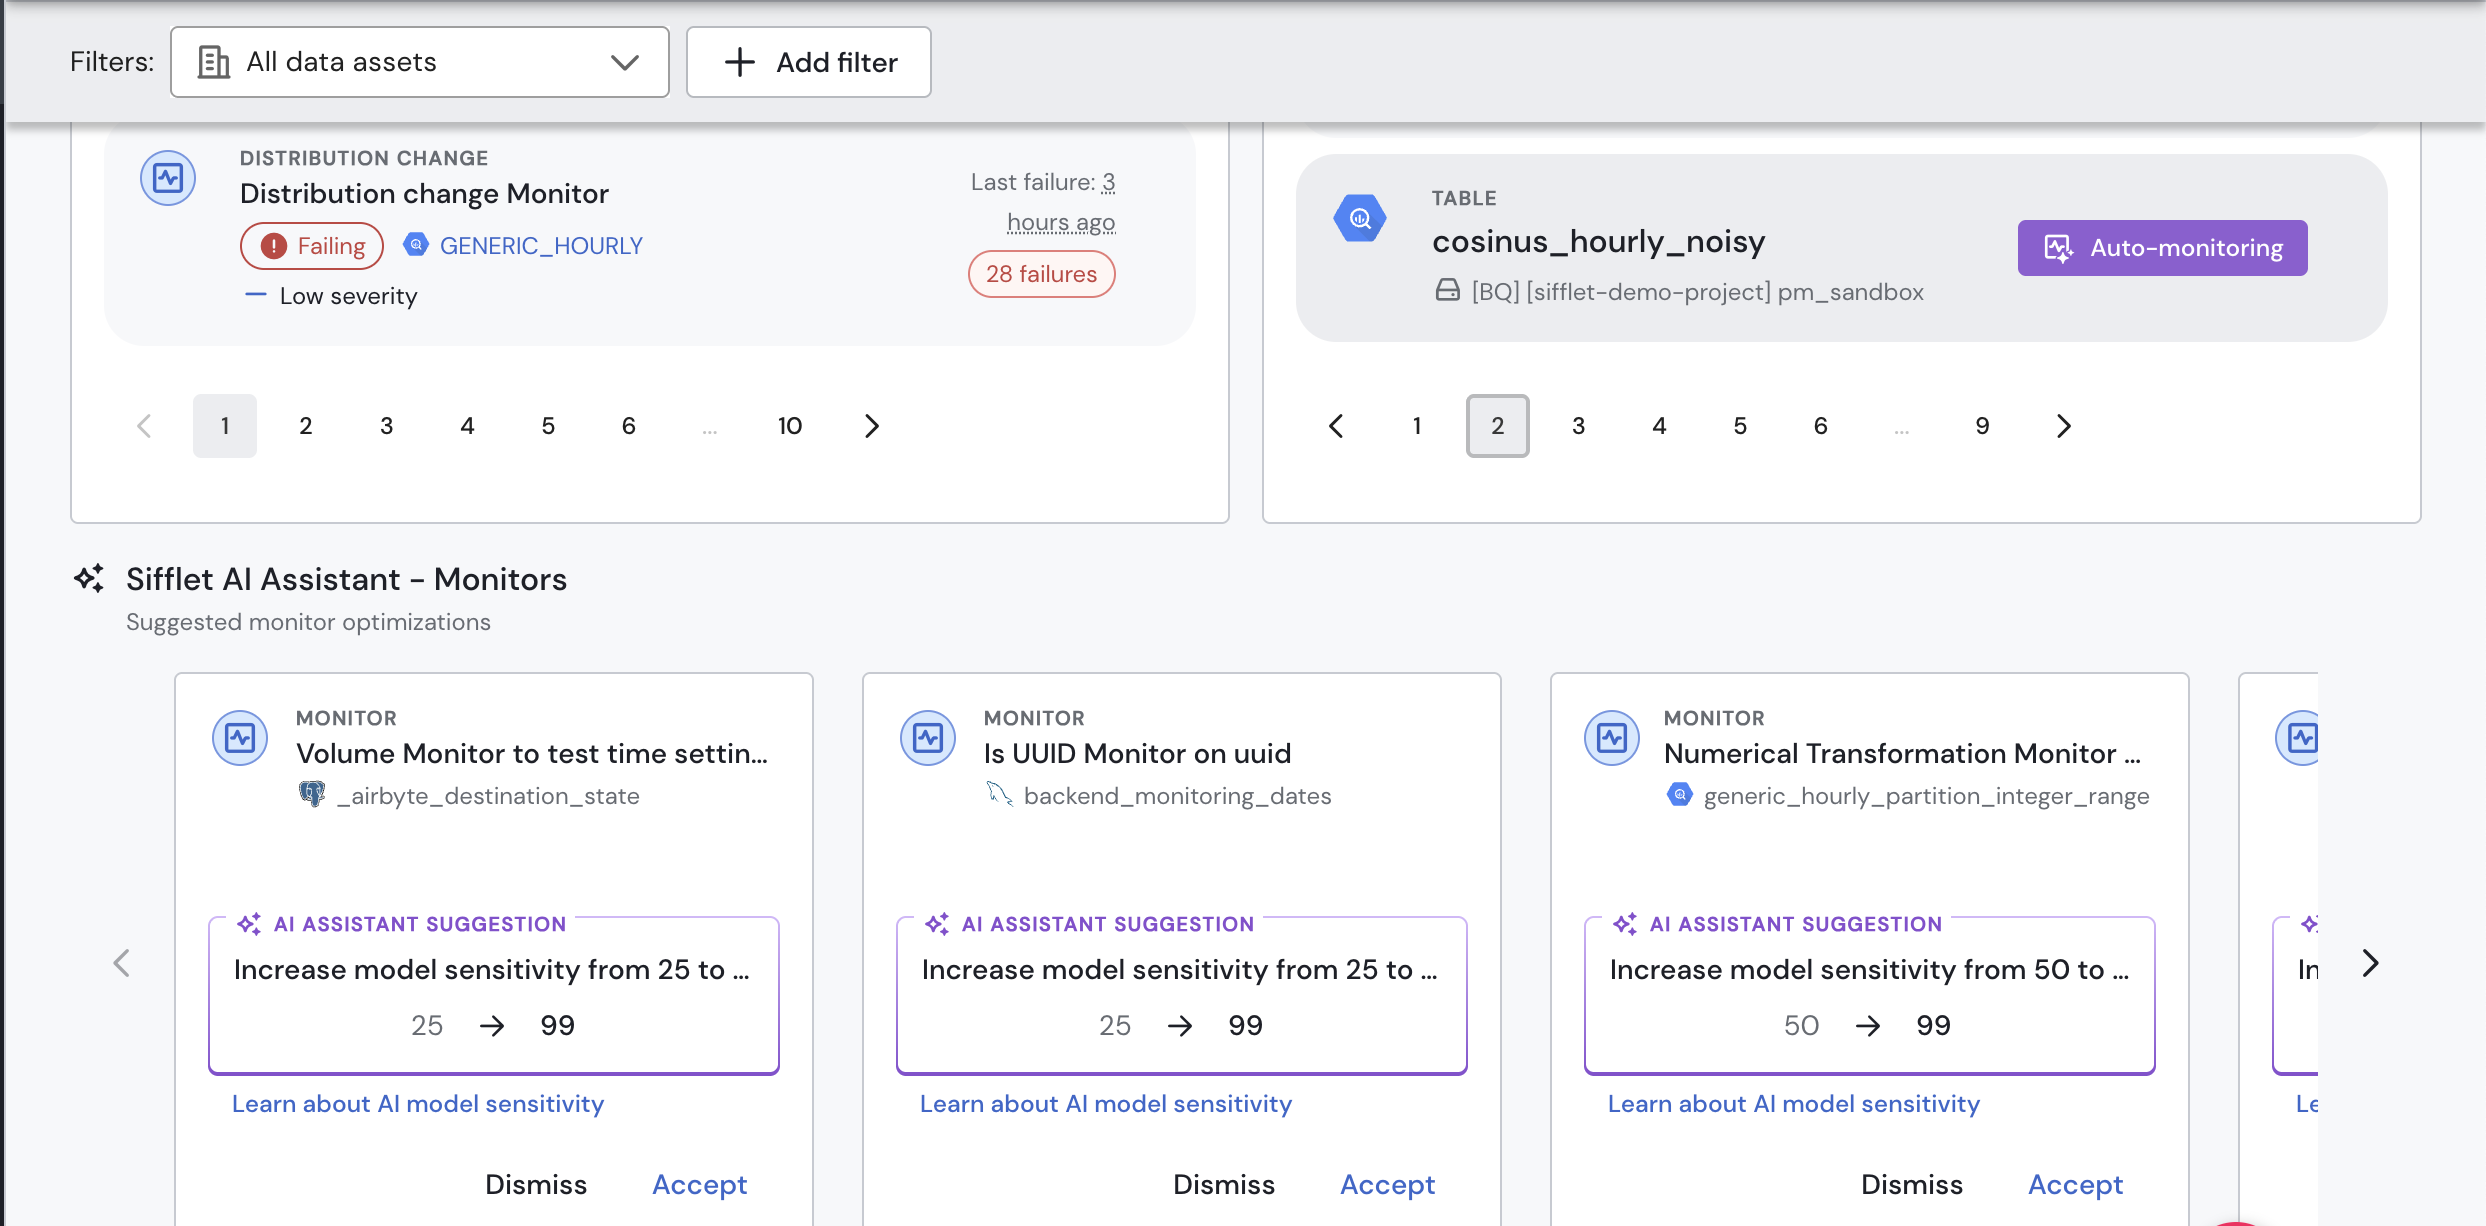
High-Usage Assets Without a Monitor
Highlights high-usage assets that currently have no monitor, ranked by usage. This helps you identify monitoring gaps and prioritize the assets where undetected issues could have the greatest impact.
Available for: Snowflake and BigQuery assets.
You can enable Auto-Monitoring (Sentinel) directly from this widget to start covering these assets in one click.
Sifflet AI Assistant - Monitors
Provides monitor-related recommendations and insights through the Sifflet AI Assistant, helping you move from identifying an issue to deciding what to do next.
3. Are Incidents Being Handled?
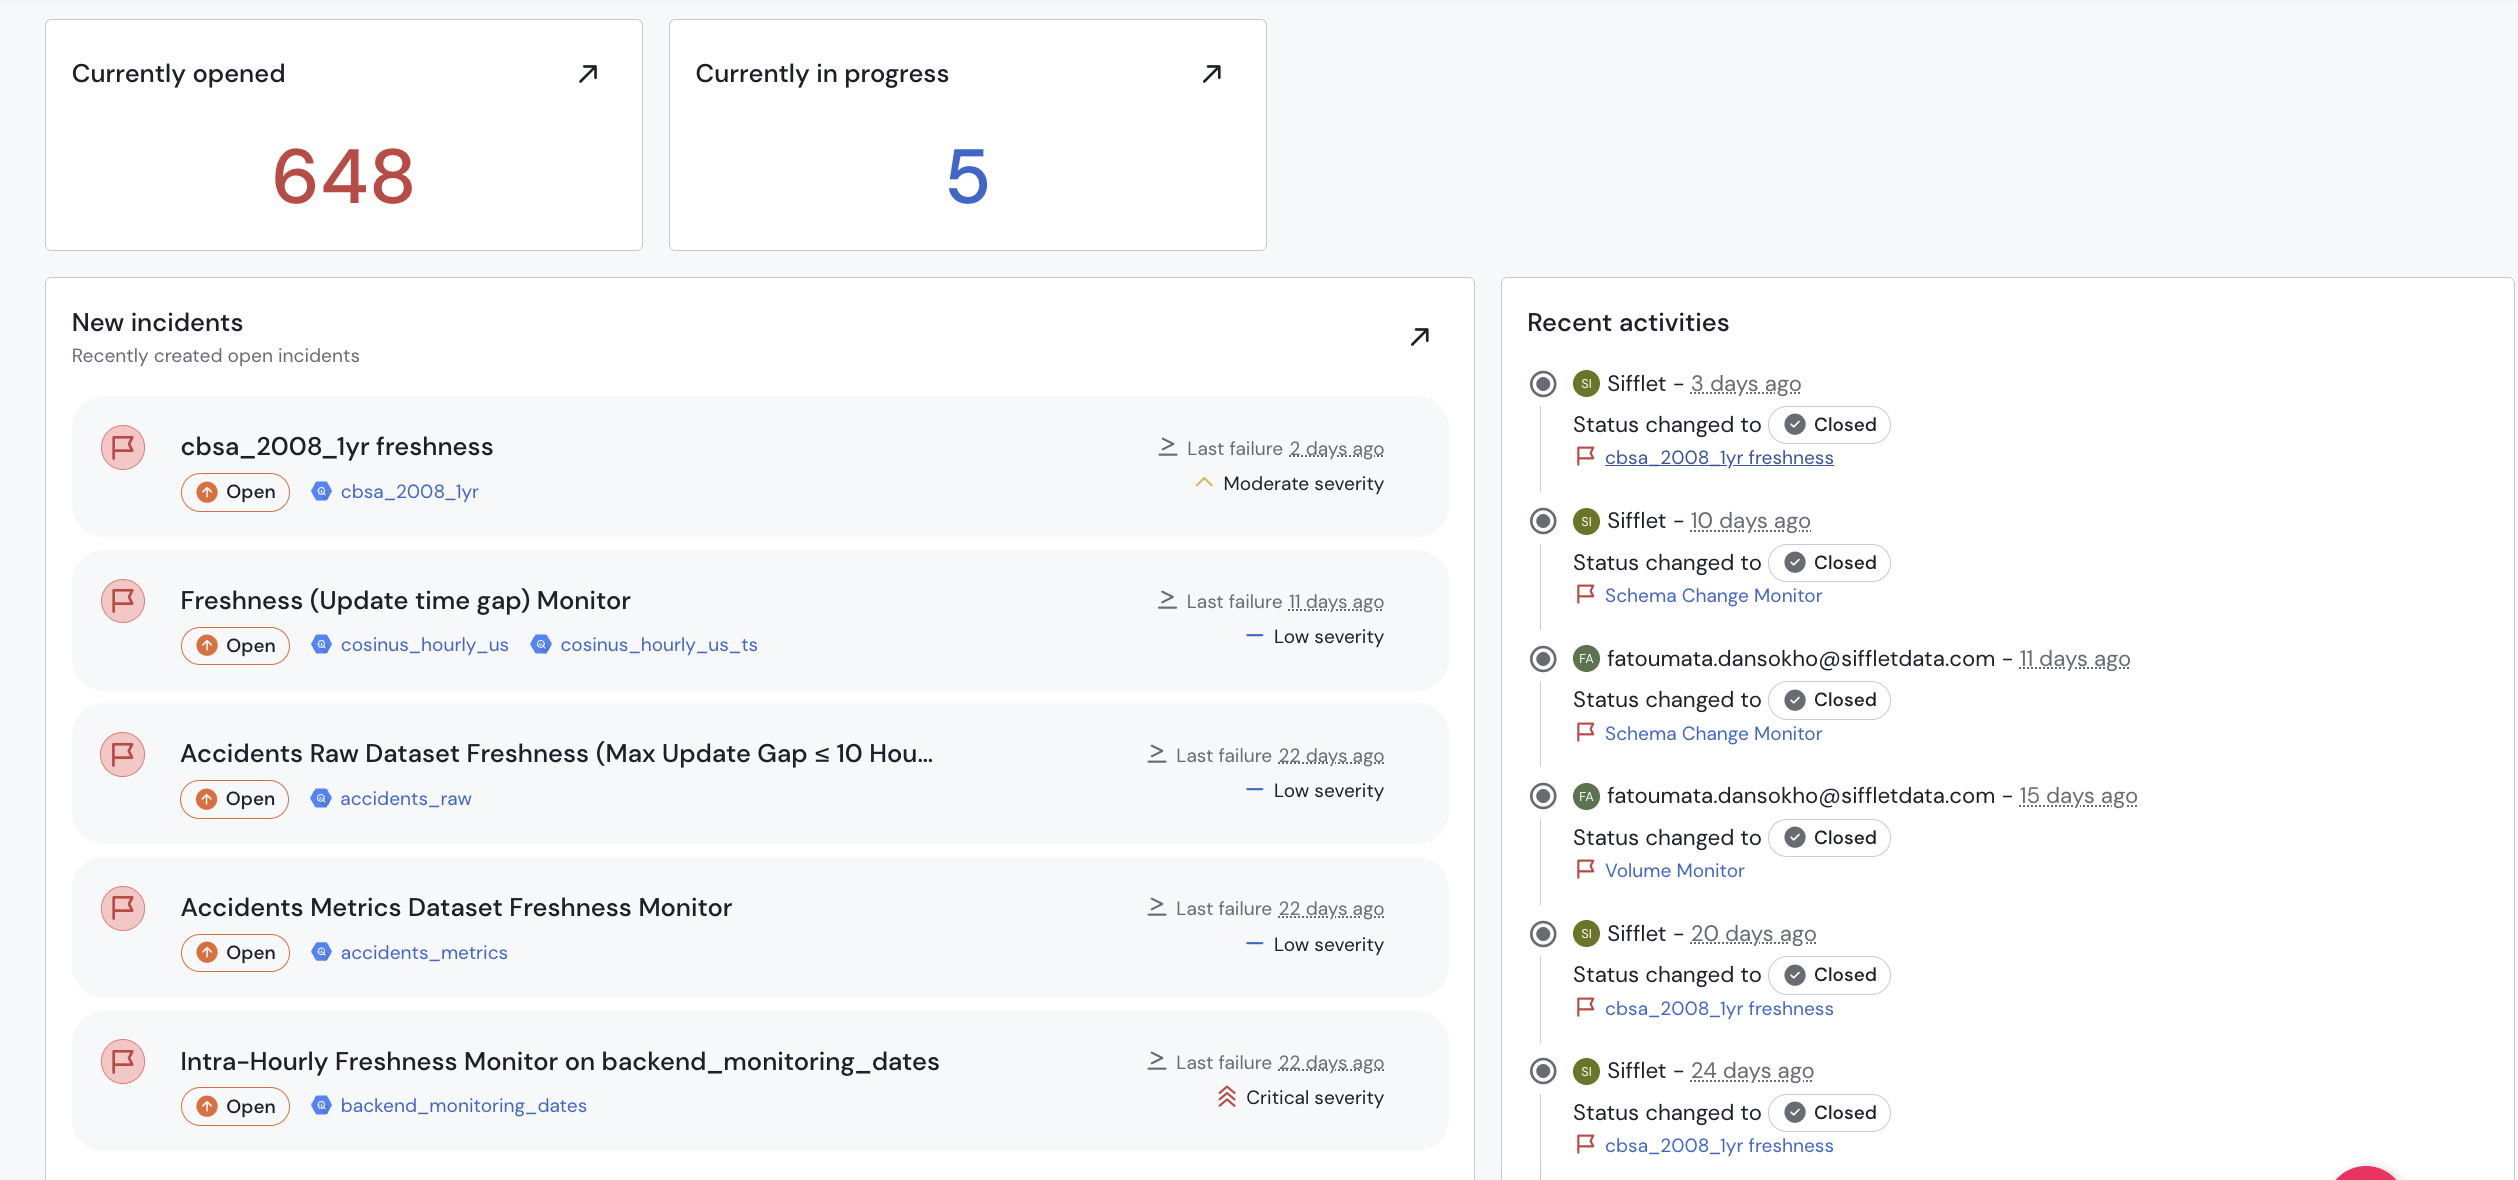
Incident Overview
Provides a real-time view of incidents that require attention.
- New Issues: Shows recently created incidents and the assets they affect.
- Recent Activity: Shows recent actions taken on incidents, such as assignments, comments, and status changes.
Recent activity helps distinguish incidents that are actively being handled from those that may be unattended.
4. What Is Impacted?
Impacted Assets
Shows assets currently affected by open incidents, from two perspectives:
- High-Incident Assets: Most impacted assets, associated with the highest number of incidents.
- High-Usage Impacted Assets: Assets ranked by usage. (Available for Snowflake and BigQuery assets.)
This helps you prioritize based on both business impact and incident volume.
Impacted Dashboards
Shows downstream dashboards affected by open incidents and the number of incidents impacting each one.
This connects technical issues to their downstream impact, helping you understand which consumers may be affected and prioritize accordingly.
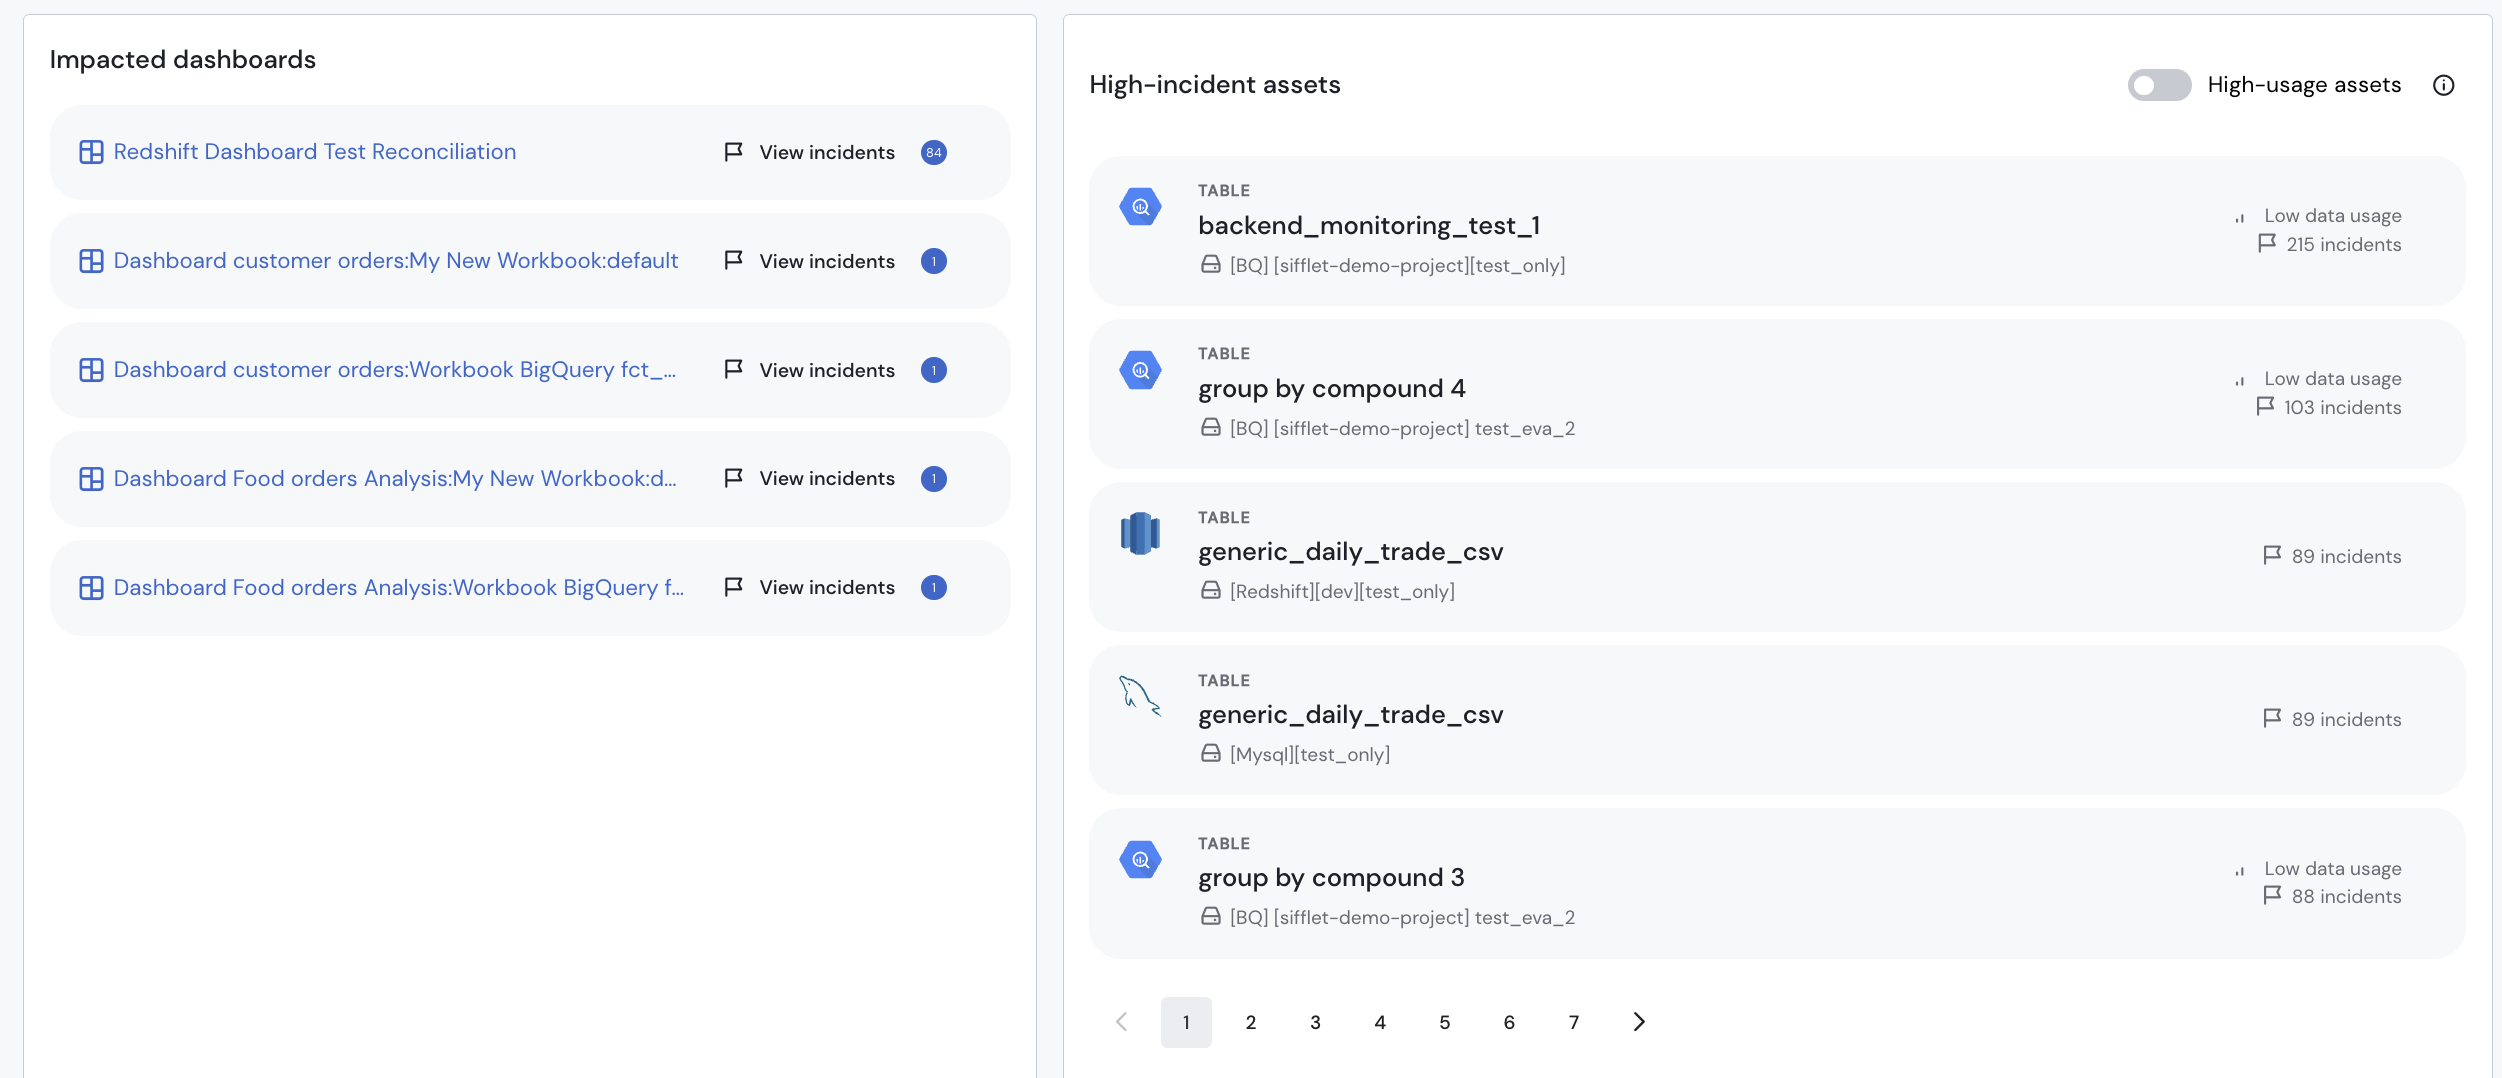
Impacted assets and impacted dashboards
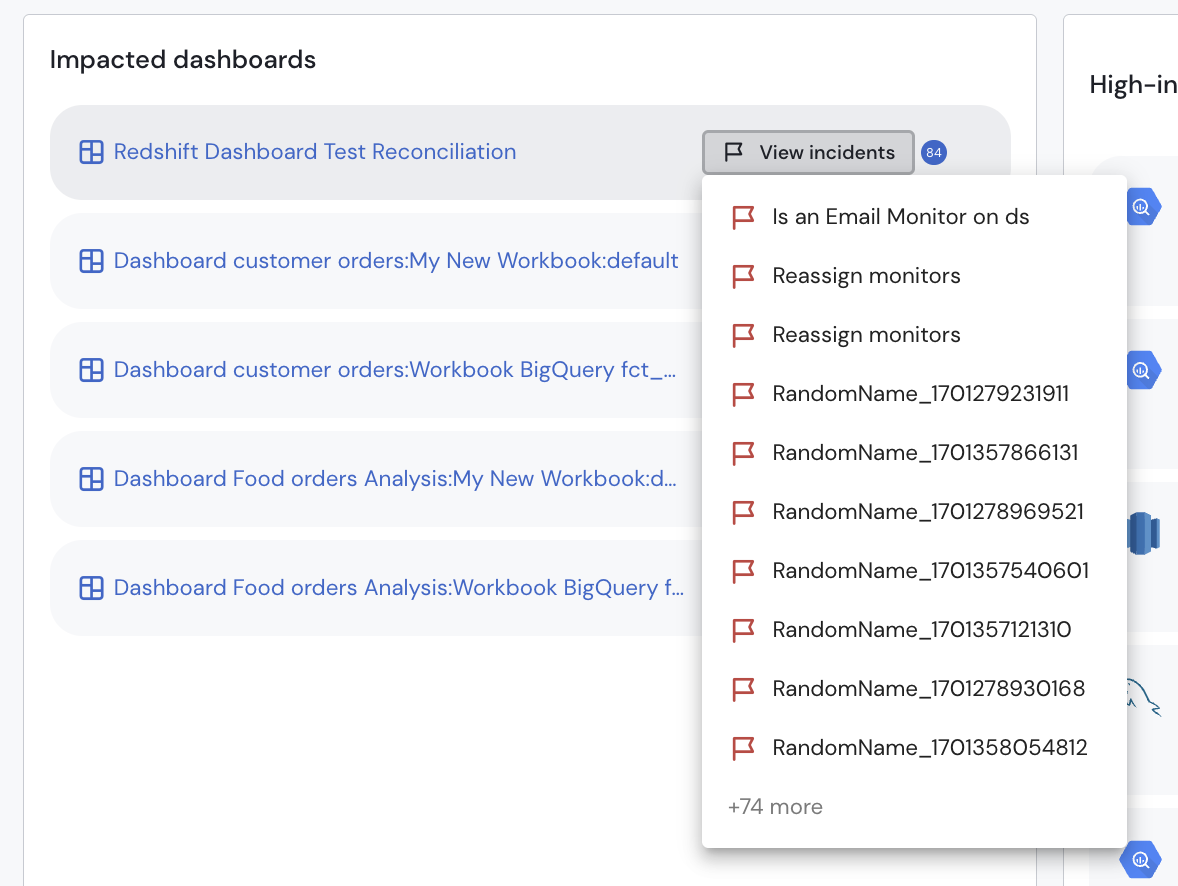
Click on view incidents
Updated 23 days ago