Incidents
What's an Incident?
In Sifflet, an incident represents a specific, actionable issue or problem with your data. Think of it as a centralized hub for investigating and resolving a data quality problem.
An incident is triggered when Sifflet detects a problem via the result of a Monitor run or a dbt test. Every incident can contain one or multiple related failing checks, such as:
- Monitor Failures: One or more of your configured monitors have failed.
- dbt Test Failures: A dbt test has failed, indicating a problem with your data transformations.
To help you focus on the root cause and avoid alert fatigue, Sifflet intelligently groups related failures into a single incident based on grouping rules. This ensures that multiple symptoms of the same underlying problem are managed together.
The Incidents List Page
The main Incidents page provides a high-level overview of all the data incidents that have been created in your Sifflet environment.
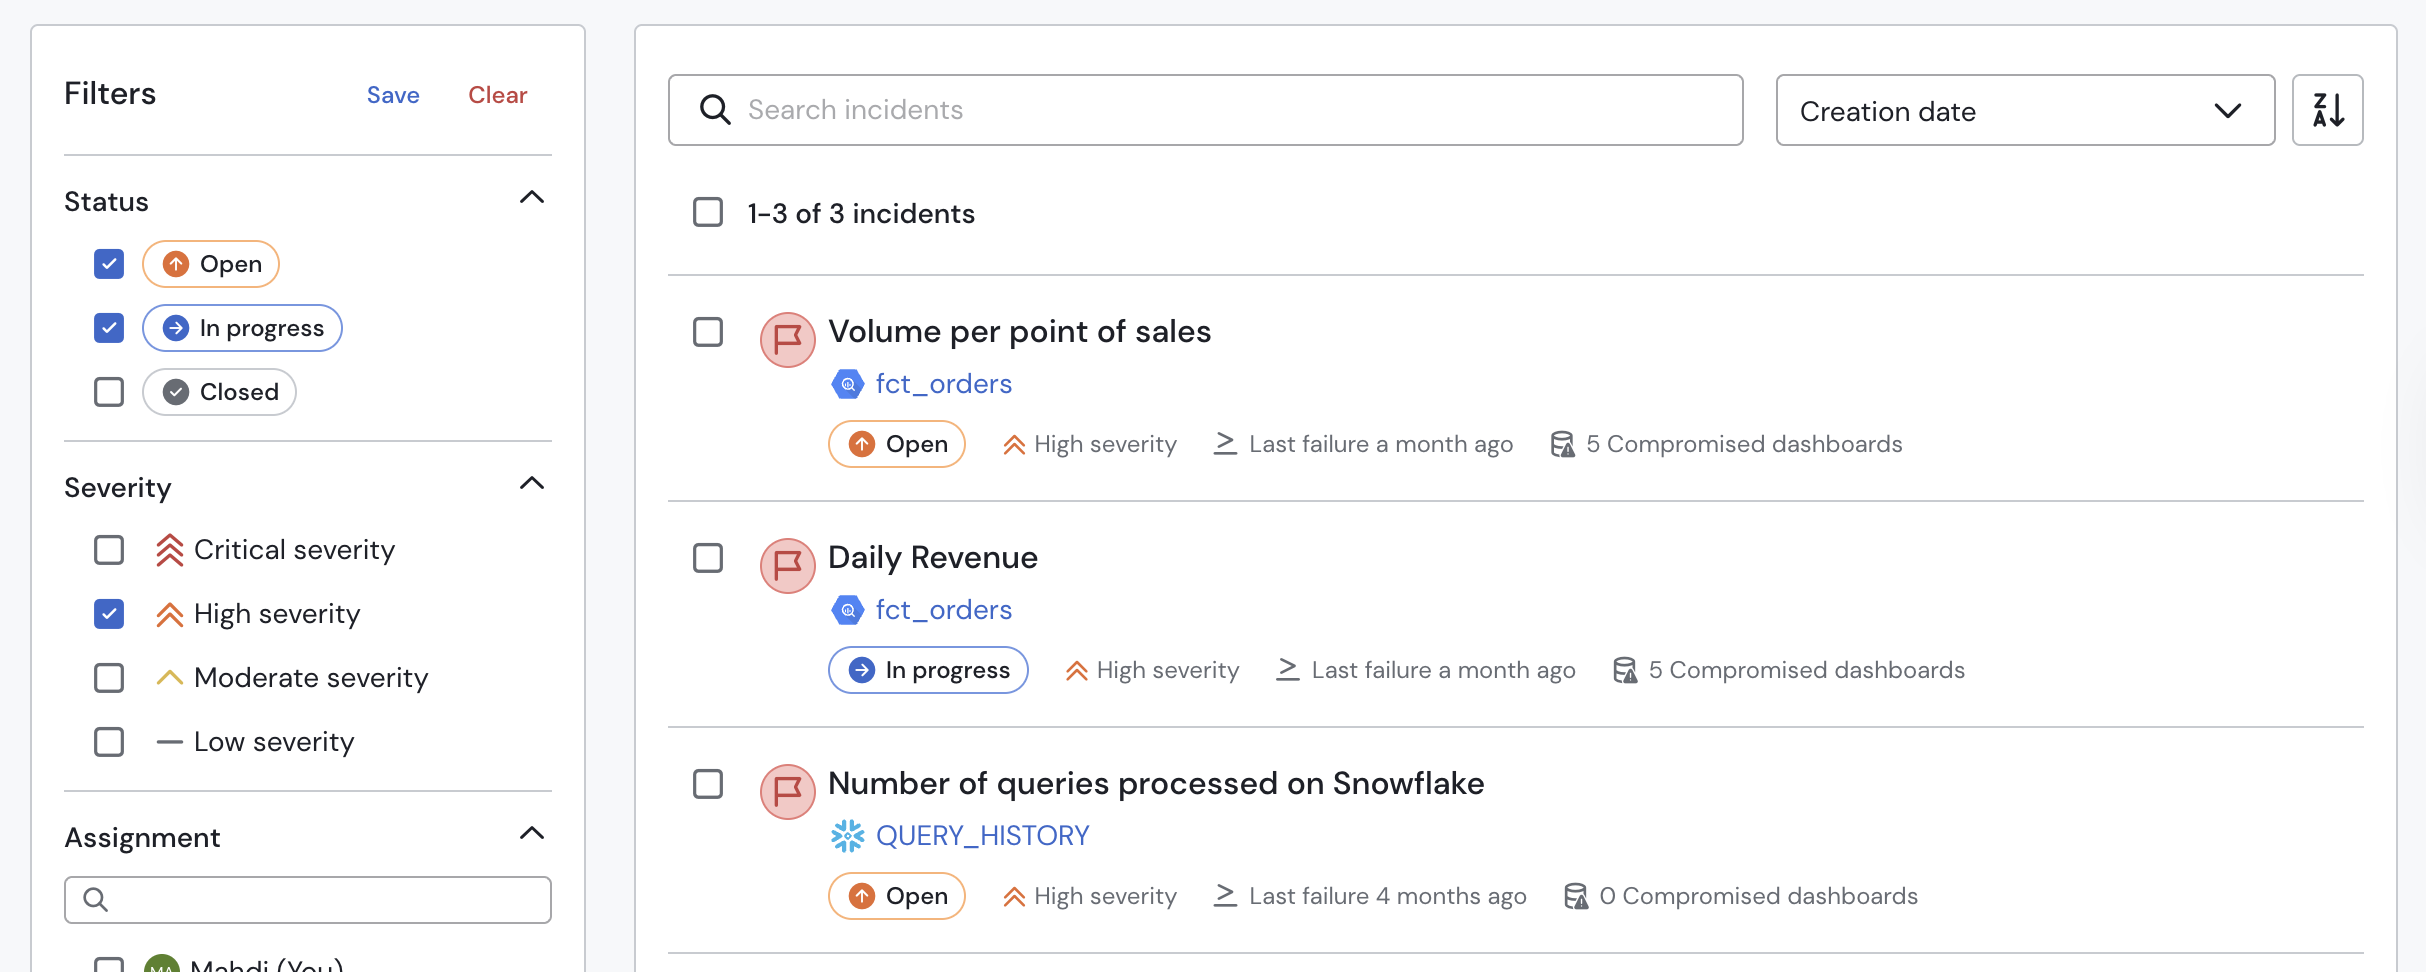
The Incidents list page
From this page, for every incident, you can quickly see:
- Name: The name of the incident. This is automatically generated by Sifflet (and updated when new failing monitors are added to the incident), but can be changed manually.
- Data assets: The list of data assets affected by the incident.
- Severity: The severity level of the monitor that triggered the incident.
- Status: The current status of the incident (Open, In Progress, or Closed).
- Assignee(s): The user or team members assigned to investigate and resolve the incident.
- Last failure timestamp: The timestamp of the last failed monitor run for monitors that are part of this incident.
- Number of compromised dashboards: The number of dashboards impacted by this incident.
The Incident Detail Page
Clicking on any incident from the list opens the incident detail page. The page is organized around a persistent header and five tabs, each surfacing a distinct type of information.
The Incident detail page – Overview tab
Header
The header is always visible regardless of which tab you are on. It shows:
- Title: The name of the incident (editable via the Edit button).
- Status chip: The current status of the incident — Open, In Progress, or Closed. Click the Status button to update it.
- Severity: The severity level inherited from the triggering monitor(s).
- Action buttons:
- Status — Opens the status picker to update or close the incident.
- Create Jira / ServiceNow issue — Raises a linked ticket in your connected ticketing tool (if configured).
- Edit — Opens the edit panel to update the title, severity, and assignee.
- More (⋯) — Additional options.
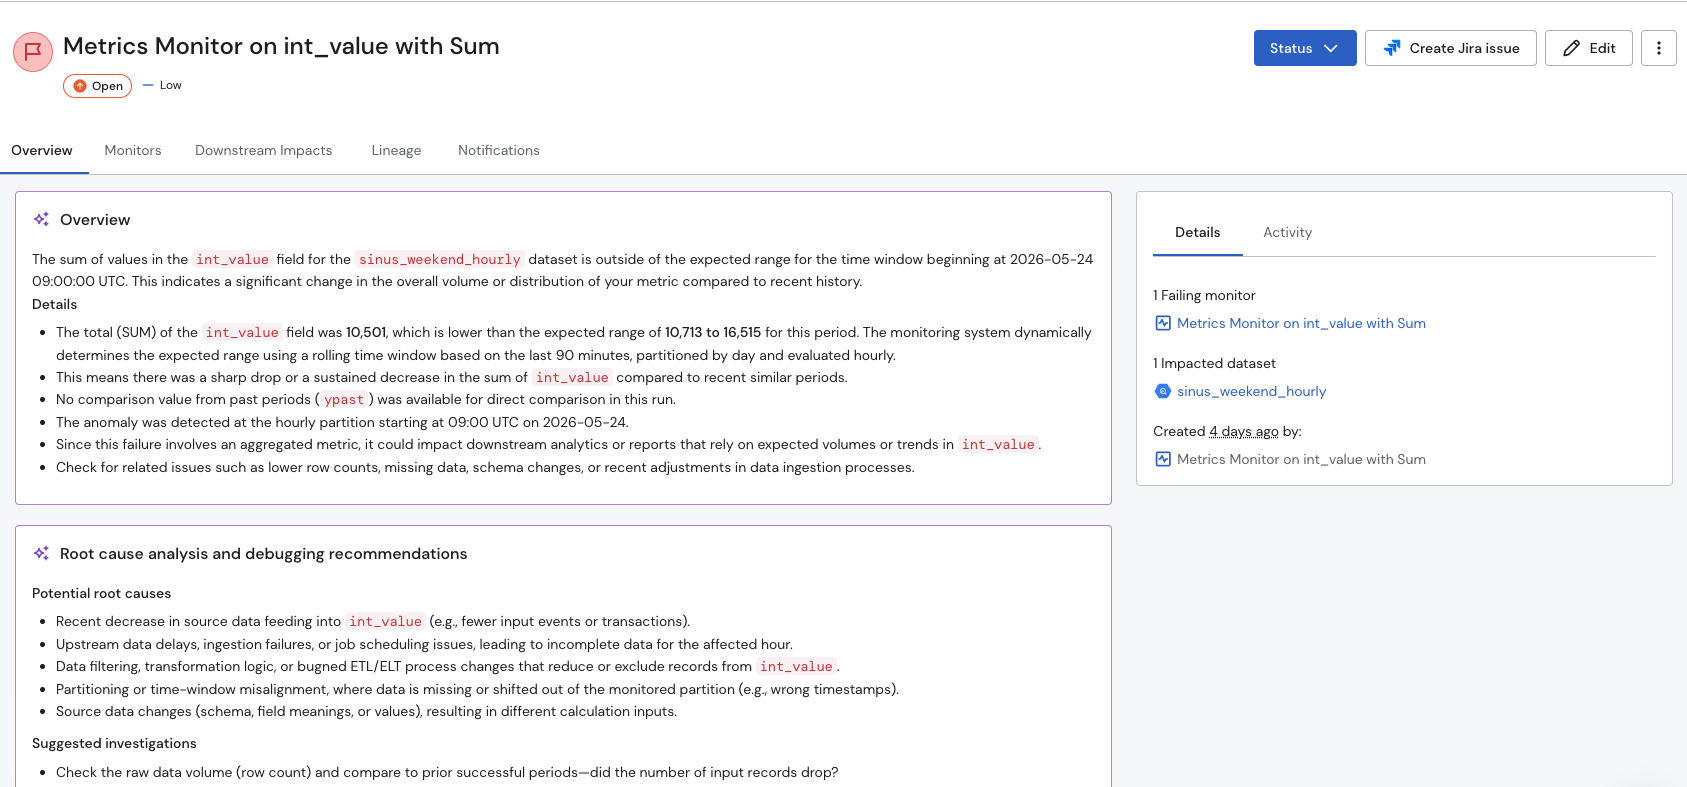
Overview Tab
The Overview tab is your starting point for root cause analysis. It is split into two panels.
Left panel — Incident description:
- Overview: A high-level summary of the incident and the failing monitors.
- Details: An in-depth description of what went wrong.
- Root Cause Analysis (RCA): Sage's analysis of the likely root cause of the incident, when the AI agent is activated in your environment.
AI-generated descriptionsIf the Root Cause Analysis AI agent (Sage) is active in your environment, the Overview, Details, and RCA sections are generated automatically and updated as new monitors are added to the incident.
Right panel — Details sidebar:
- Failing monitors count: The total number of monitors currently failing within this incident.
- Impacted dataset: The primary data asset(s) affected.
- Assignee: The user assigned to the incident.
- Impacted dashboards: A summary list of downstream BI dashboards affected by this incident.
- Activity feed: A chronological log of all events on the incident — creation, status changes, new monitors being added, assignee changes, comments, and when a monitor is fixed. You can leave comments directly from this panel.
Seeing events from incident/ticket management tools in the activity feedIf you integrated Sifflet with an incident or ticket management tool (like Jira or ServiceNow), events from such tools will appear in the activity feed.
Monitors Tab
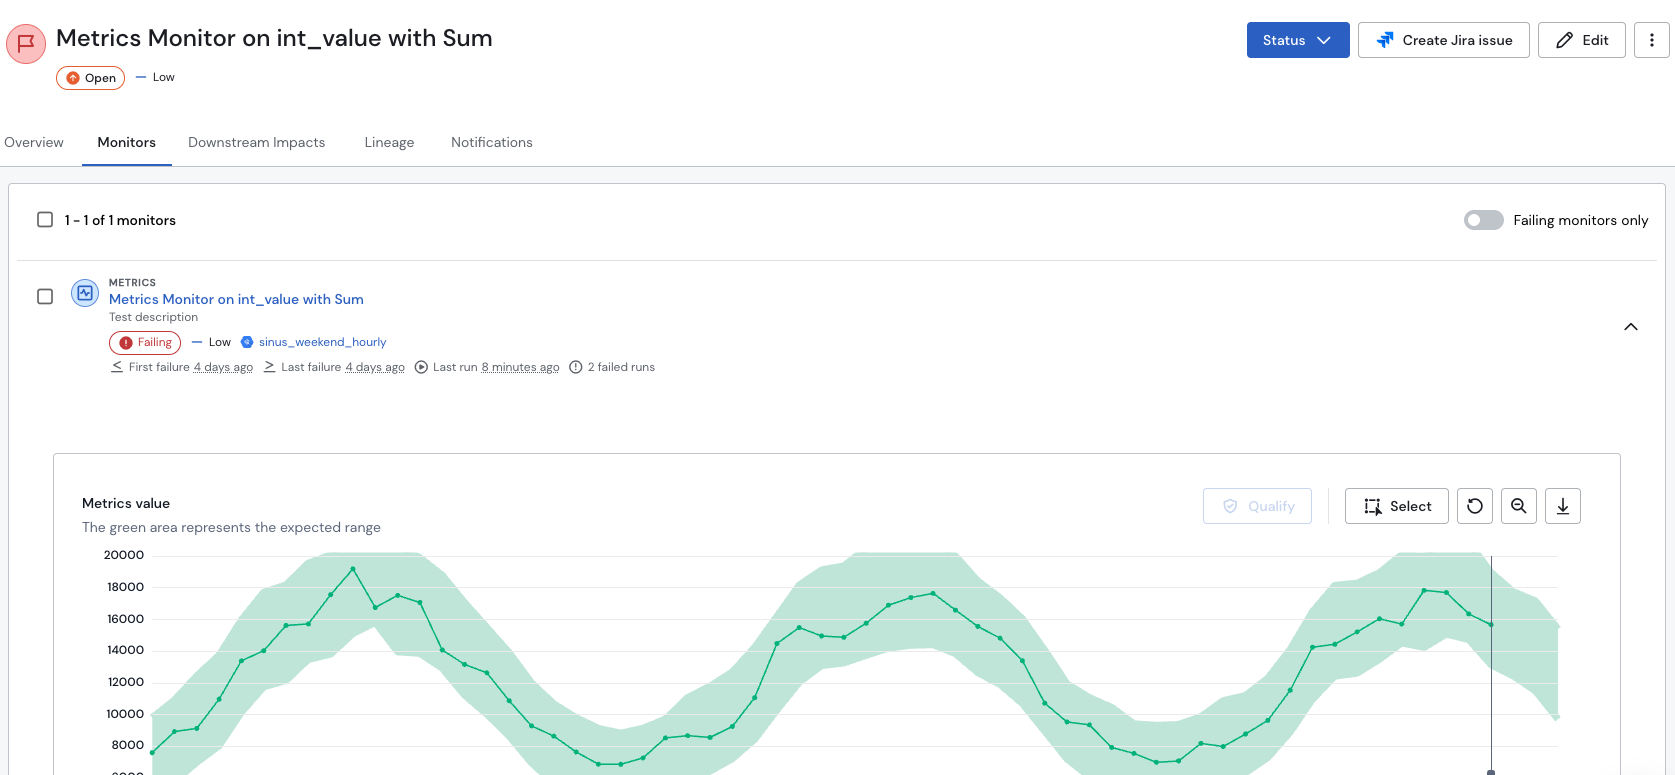
The Incident detail page – Monitors tab
The Monitors tab lists every monitor that is part of this incident, giving you full context to assess each anomaly without leaving the incident page.
For each monitor you can see:
- Monitor type and name
- Current status (Failing / Passing)
- Severity
- Impacted data asset
- First failure and last failure timestamps
- Last run timestamp
- Number of failed runs
Bulk actions are available via checkboxes: select one or more monitors to Qualify as passing or Reassign monitors to another incident.
A Failing monitors only toggle lets you filter the list to only show monitors that are still actively failing.
Impacted Dashboards Tab
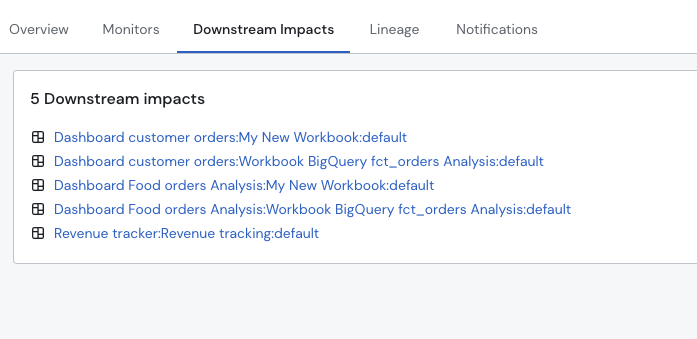
The Incident detail page – Impacted Dashboards tab
This tab lists all downstream BI dashboards (e.g., Tableau, Looker, Power BI) that depend on the data assets affected by this incident. Use this to understand the full business impact and prioritize your response accordingly.
Lineage Tab
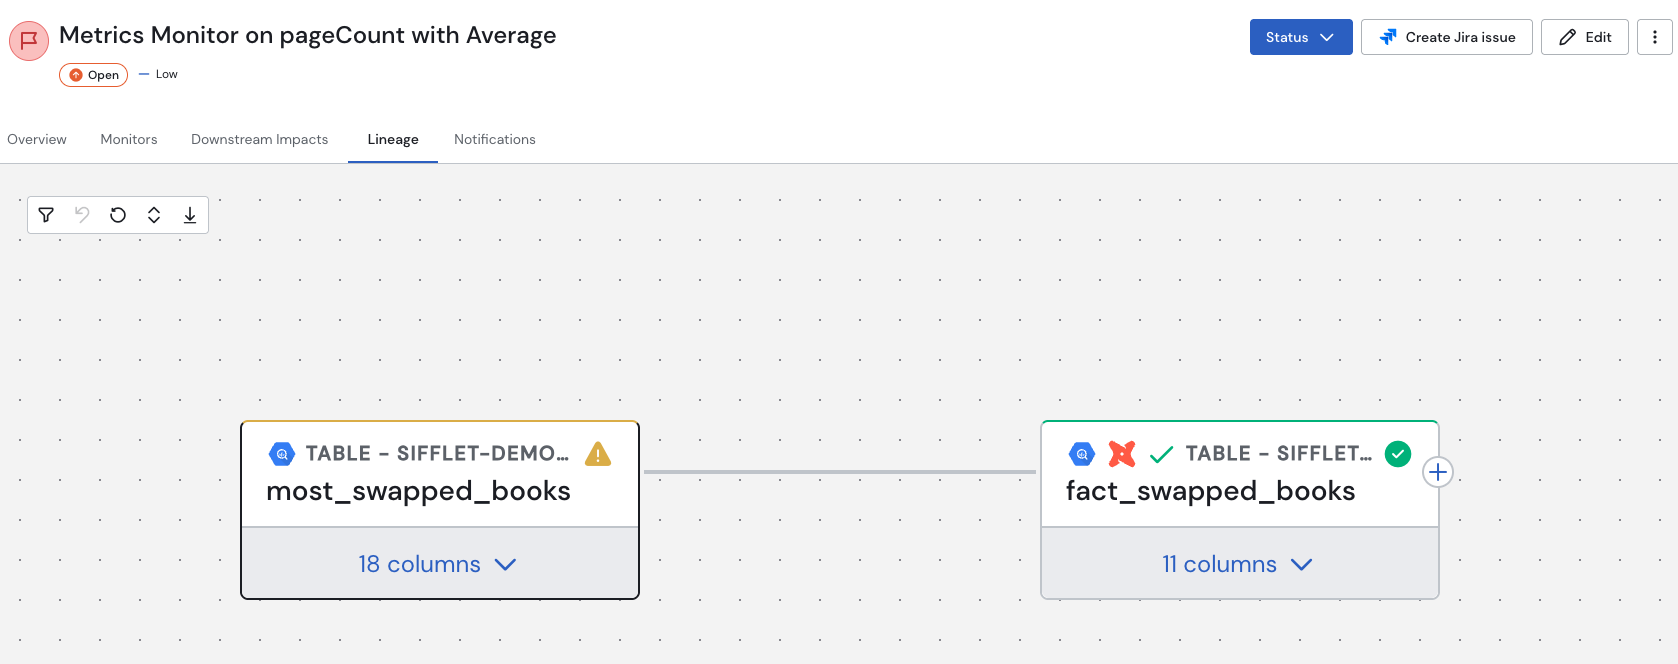
The Incident detail page – Lineage tab
The Lineage tab renders an interactive data lineage graph centered on the assets involved in the incident. Assets with failing monitors are highlighted, making it easy to trace the origin of the problem upstream or understand what is affected downstream.
Notifications Tab
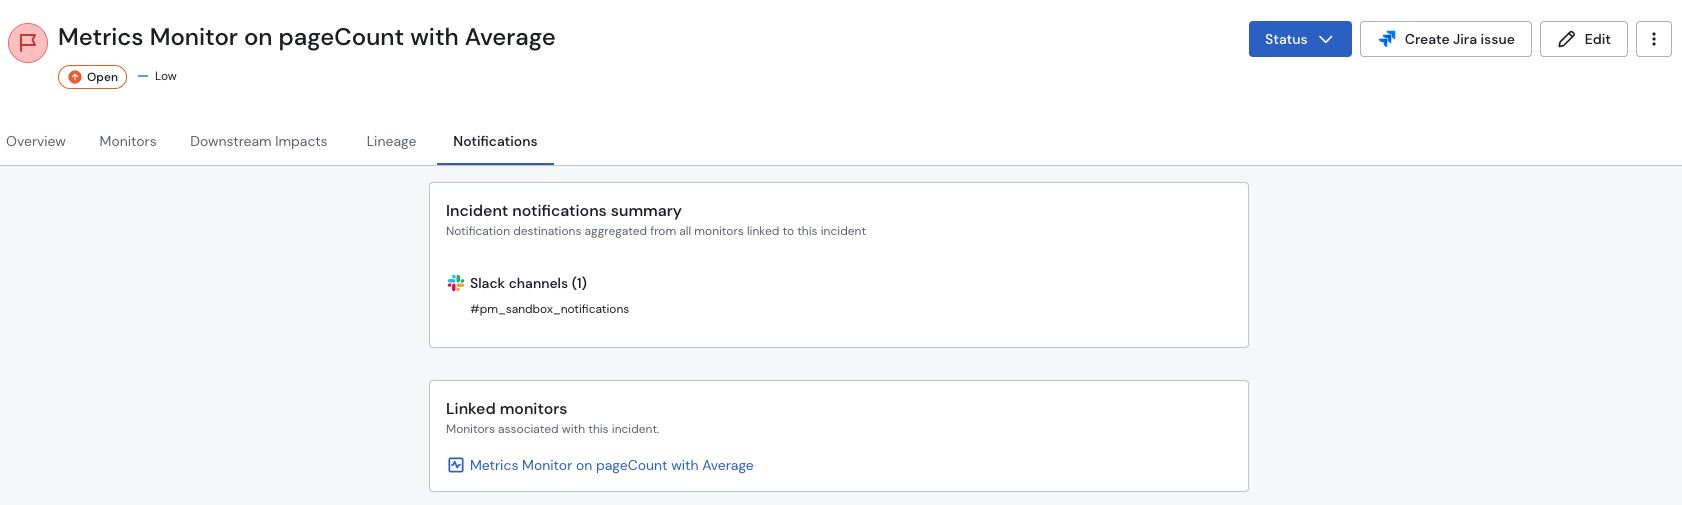
The Incident detail page – Notifications tab
The Notifications tab shows which notification destinations are active for this incident. If no rules are configured, the tab will display an empty state prompting you to set up notification destinations. Notification rules are managed from the Integrations settings.
Updated about 2 months ago