Monitor Setup
Overview
Monitors can be created manually either through the Monitor List Page by clicking on the New button, in the top-right of your screen, or through an Asset Page in the Sifflet Data Catalog. Compared to Auto-Coverage, creating a Monitor manually offers access to a broader range of monitoring logics.
How to setup
Monitor Templates
The first step is selecting an asset you want to monitor. Then, you will have to choose the monitoring category to be applied. You have various possibilities depending on your data, your business case and the criticality of that data. A wide range of Monitors is available in the Template Library.
Modes - static vs dynamic
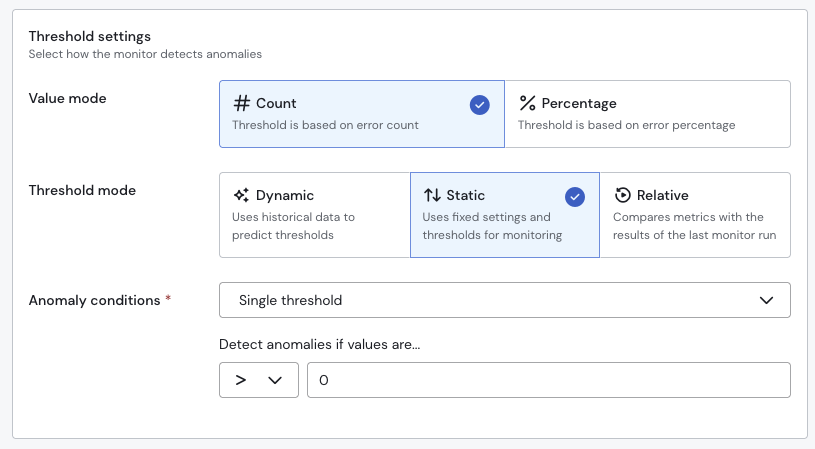
You have the possibility to implement a monitor based on either static or dynamic thresholds computed with machine learning models. What we advise is to use:
- Static: for known business cases. For instance, when you want to monitor a price that must remain within a given price range.
- Dynamic: when you don't have specific thresholds but still want to detect any anomaly.
- Relative: to make comparison with the value from the previous run. It can against a single threshold or a compound threshold (e.g. new value > old value + 10 OR new value < old value - 10).
If you use an ML-based monitor, an important parameter will be the historic: the number of minutes, hours or days of recorded data on which ML models will train. You should select this parameter according to the business periodicity you want to be detected by the model.
By default models train on 365 days of data.
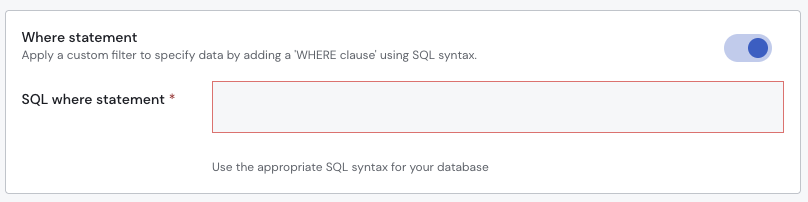
WHERE clause
For all monitors, it is possible to add a WHERE clause using an appropriate SQL syntax, to filter records with conditions.
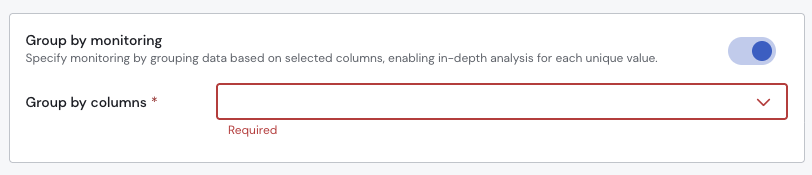
GROUP BY field
Finally, GROUP BY will enable you to increase the granularity of your monitoring. Each unique value of the selected field will be sub-monitored within the run of your monitor.
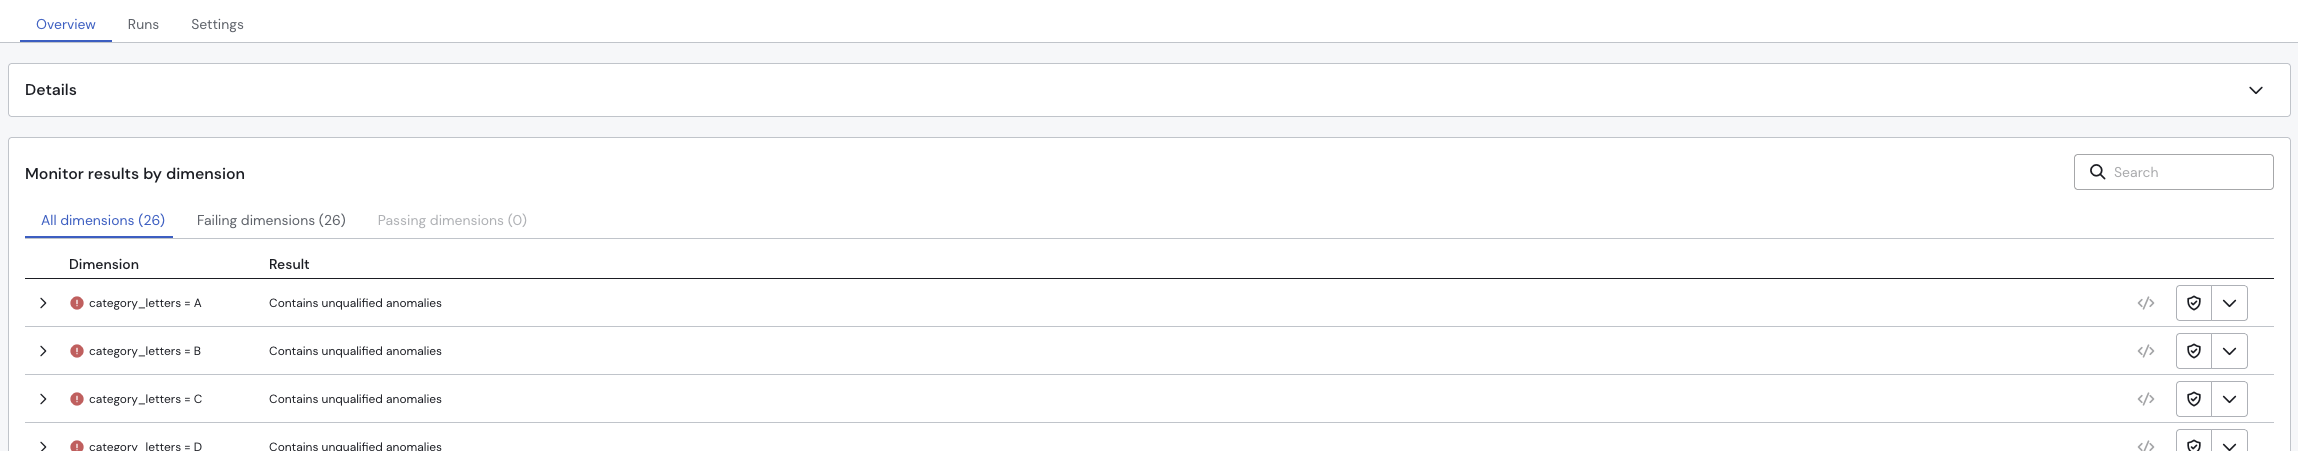
How to access results
You will receive a granular success or failure status for each dimensional value tested.
Updated 7 months ago