

Correlated Metrics
Overview
The Correlated Metrics monitor tracks two or more related metrics and uses machine learning models to detect anomalous changes between them.
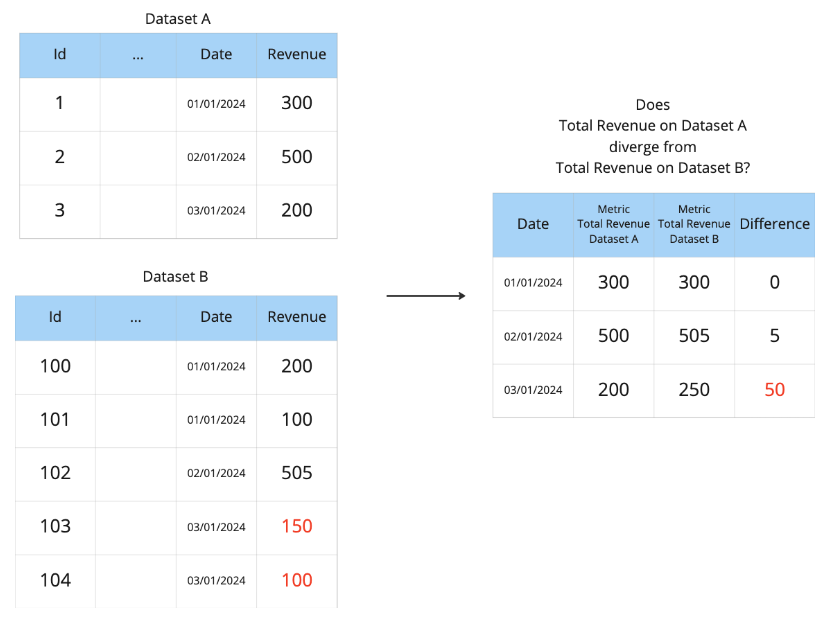
Correlated Metrics Monitoring on Dataset A and B, on Total Revenue
How To
Use
You can use the Correlated Metrics monitor on two or more metrics. Sifflet then considers the time series of the maximum difference between the metric values.

D: time series of the max difference
M: metric
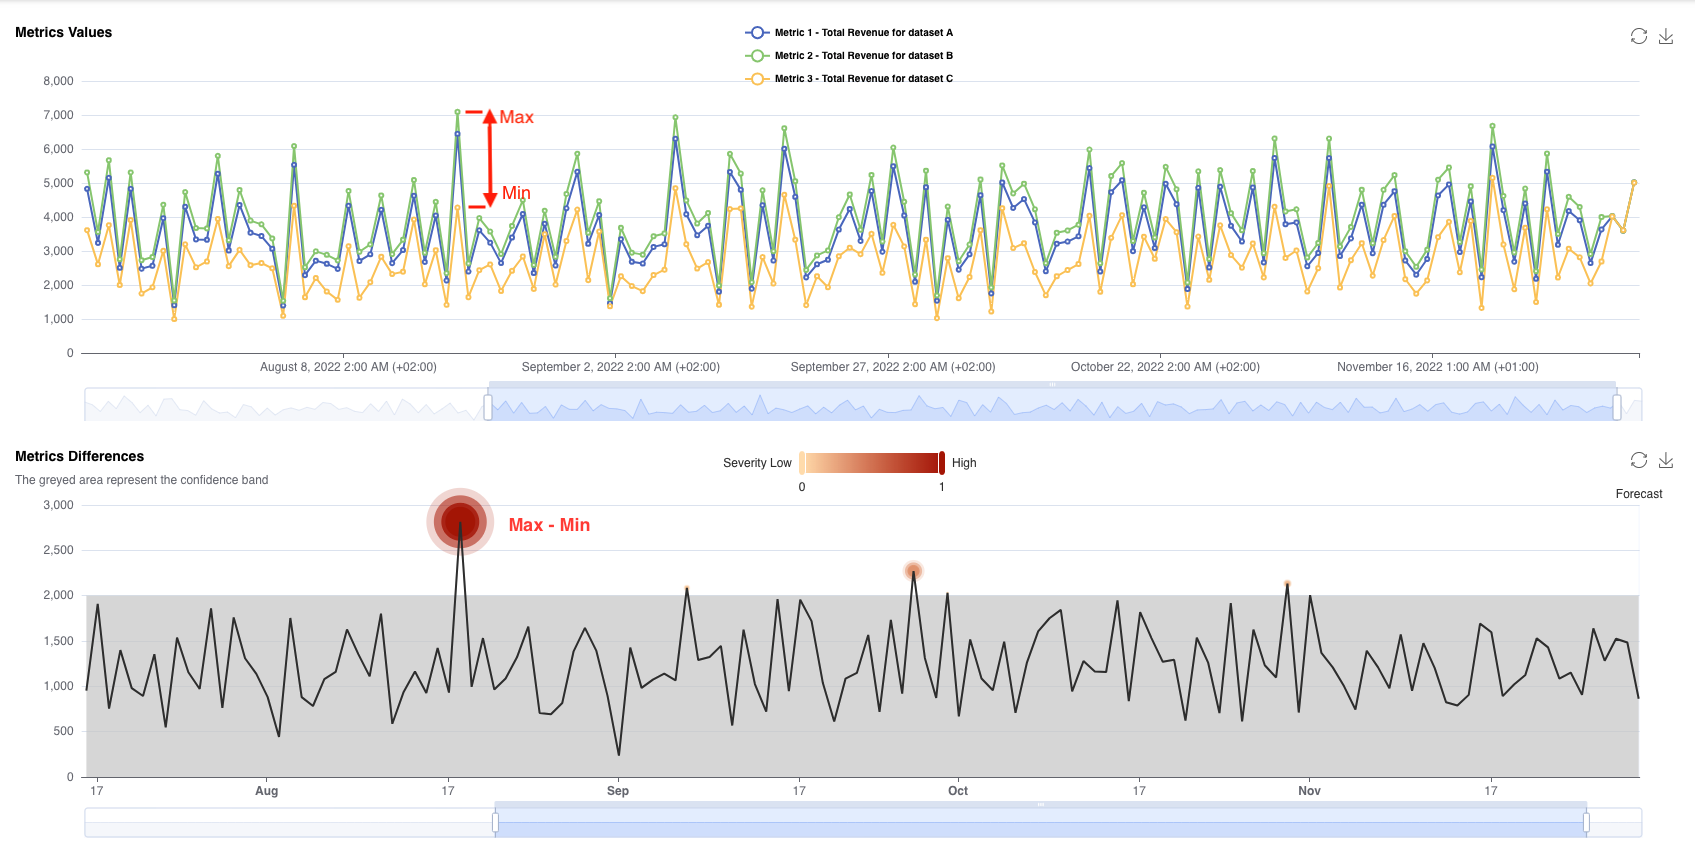
Correlated Metrics: monitor 3 similar metrics on 3 different datasets with static comparison type (see below)
Configuration
The Correlated Metrics template is in the Metrics templates category.
Monitoring Type
There are three monitoring types available: Dynamic, Static, Exact.
Dynamic
The monitor fails if the model finds any anomaly based on previous trends. You do not need to define a threshold.
Static
The monitor fails if the difference passes a predefined threshold. For instance, to configure the rule to fail when a metric diverges from others more than 1000, choose the Single threshold anomaly condition, then set Detect anomalies if values are... to Greater than 1000.
Exact
The monitor fails if the metrics do not have the exact same values.
Use Cases
One useful monitoring use case is when you want to monitor strongly correlated metrics, whether they represent the same metrics from different environments or the same metrics but computed differently.
FAQ
- How do I monitor metrics on the same dataset?
You can add the same dataset twice at the beginning of the monitor creation.
Updated 13 days ago