

Asset Health Status
Overview
Data Catalog and lineage pages surface health statuses for Tables & Views assets. In the Data Catalog filters, the health status appears as Quality status. This health status allows your teams to:
- Quickly grasp the health state of your assets, making data self-service more reliable
- Swiftly perform root cause analysis and impact assessment by visualizing where a data quality issue originates and which assets it impacts
How Is Asset Health Status Computed?
Asset health status is based on whether or not the asset is covered by monitors as well as on the severity of the incidents impacting the data asset:
- Urgent incidents: asset has at least one configured monitor and asset has at least one ongoing incident with a
Criticalseverity. - High risk incidents: asset has at least one configured monitor and asset has at least one ongoing incident with a
Low,Moderate, orHighseverity. - No incidents: asset has at least one configured monitor and does not have any ongoing incident.
- Not monitored: asset does not have any configured monitor.
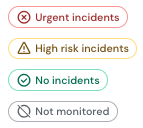
Possible Quality Statuses
Updated 22 days ago
Did this page help you?