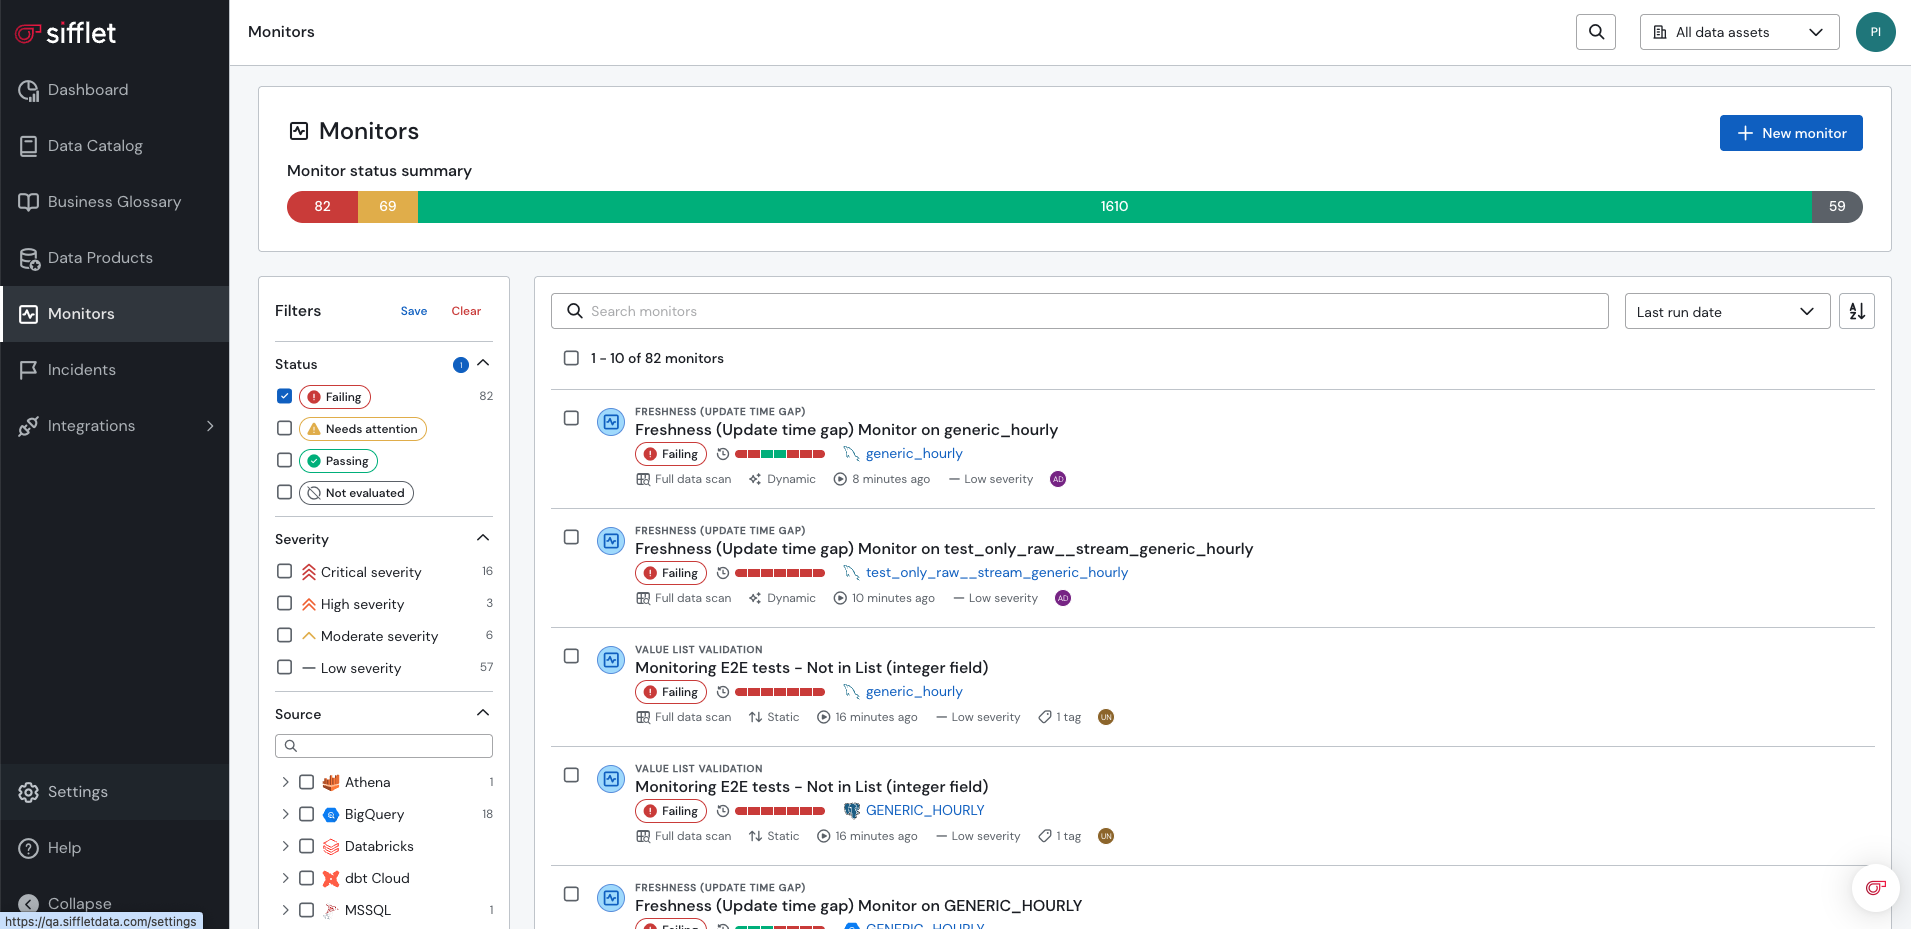
Monitors
Overview
Monitor List Page is an overview of the current state of your setup, it's performance and results.
![](https://files.readme.io/a9b5baf-image.png)
How to
Last Runs Status Summary
A summary of statuses of last Monitor Runs offers a quick overview of the state of your setup.
![](https://files.readme.io/772b4f3-image.png)
Monitor List Page
An overview of all monitors configured on your data assets.
![](https://files.readme.io/d325206-image.png)
For each monitor, you will find a summary displaying information such as:
- Template name
- Monitor name
- Data Asset(s) being monitored
- Last Run Status
- Overview of the last 7 runs
- green = success
- red = failure
- orange = technical error / requires attention
- grey = no run yet
- Time of the last run
- Dataset Tags (grey)
- Business Tags (white)
- Features and characteristics (e.g. multi-dimensionality)
- Severity
- Run Schedule
Monitor Details Page
Clicking on a Monitor will open a Monitor Page with more information available in 3 tabs: Overview, Runs, Details.
![](https://files.readme.io/a1724d7-image.png)
Overview
An overview of your monitor latest state, with graph(s) of the latest run.
![](https://files.readme.io/5017dba-image.png)
Runs
An overview of results of all past Monitor Runs, including their time, duration and trigger mode (scheduled or manual).
![](https://files.readme.io/757aec0-image.png)
Details
A detailed summary of all monitor parameters.
![](https://files.readme.io/b820adc-image.png)
Updated 7 months ago
What’s Next