How to Use Incidents
Why Use Incidents in Sifflet?
When a data quality issue arises, the investigation process can be chaotic. Alerts fire, stakeholders need updates, and team members scramble to find the root cause. Sifflet's incidents are designed to bring order to this process.
An incident acts as a central hub for resolving a data problem, from initial detection to final resolution. It streamlines your entire issue resolution process by:
- Consolidating Related Alerts: Automatically grouping multiple related failures into a single, manageable issue.
- Providing Rich Context: Bringing together data lineage for root cause analysis, anomaly details, and downstream impact reports in one place.
- Facilitating Collaboration: Giving your team a dedicated space to assign ownership, track progress, and communicate findings.
By managing data issues as incidents, your team can collaborate more effectively, reduce time-to-resolution, and build a reliable history of your data health.
The Incident Resolution Workflow
You've received an alert: a monitor has failed, and Sifflet has created an incident. This guide walks you through the typical workflow for investigating, collaborating on, and resolving data incidents using the Sifflet platform.
Step 1: Triage and Assign Ownership
Your first step is to assess the incident and assign it to the right person or team for investigation.
On the main Incidents page, you'll see a high-level overview. Click on the new incident to open the incident detail page.
- Review the Incident: Quickly look at the monitor(s) that failed and the impacted data asset(s). If Sifflet has automatically grouped multiple failures, you'll see them listed under the Monitors tab. You can also read the AI-generated description on the Overview tab for a quick summary.
- Assign an Owner: Click the Edit button in the top-right corner of the incident to open the edit panel. From there, set the Assignee to the right person or team. This ensures clear ownership and notifies the assigned team member that they are responsible for the incident.
- Update the Status to "In Progress": Once someone takes ownership, use the Status button to move the incident from Open to In Progress, so your team knows it is being actively investigated.
Step 2: Investigate the Root Cause and Impact
Now it's time to dig in and understand what went wrong.
Review the failing monitors:
Navigate to the Monitors tab. This lists every monitor contributing to this incident, along with its type, severity, impacted asset, and failure timestamps. Expand individual monitors to inspect their anomaly details — you can see the relevant datapoints directly from this tab without having to navigate away from the incident.
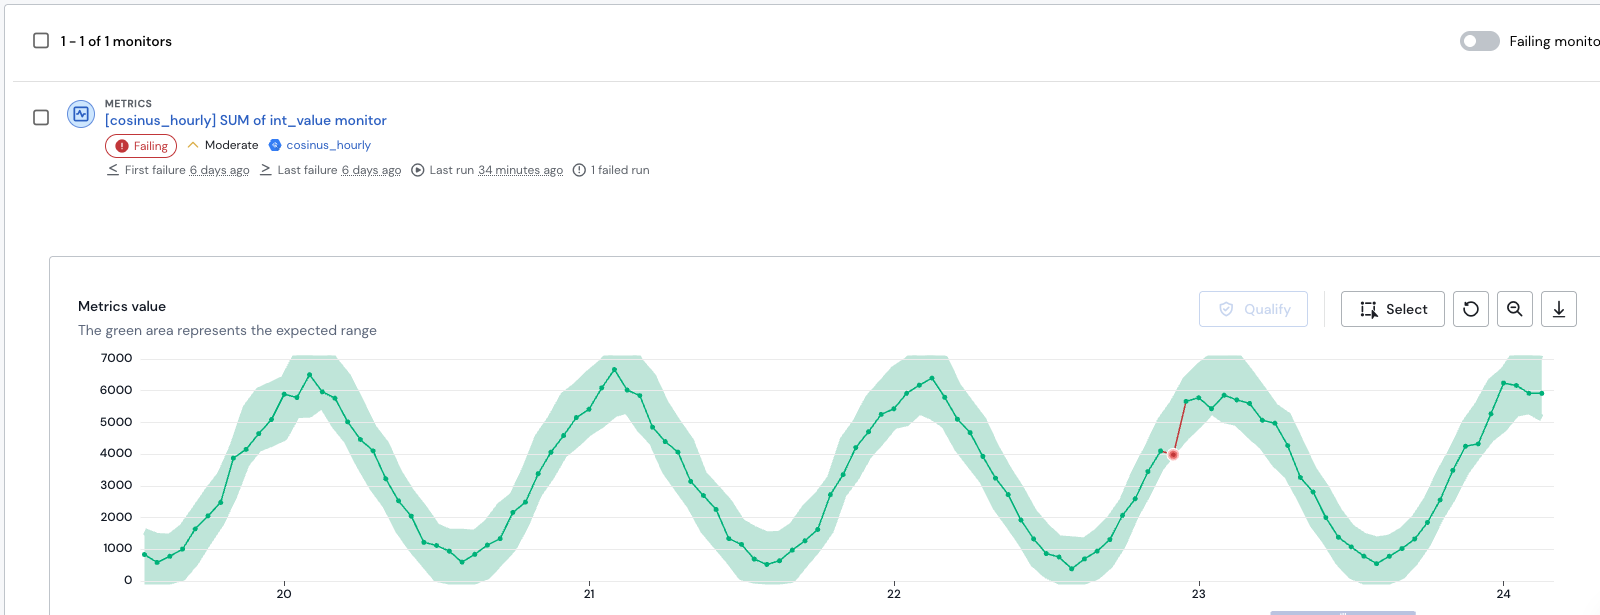
The Monitors tab showing failing monitors and anomaly details
Trace the root cause with Lineage:
Navigate to the Lineage tab. This interactive graph shows the end-to-end map of your data pipelines, with assets that have failing monitors highlighted. Look upstream from the affected asset(s) to identify potential root causes — for example, a transformation job that failed or an upstream table with its own quality issues.
Understand the Business Impact:
Go to the Impacted Dashboards tab to see all BI dashboards and reports that depend on the affected assets. This is critical for understanding the business impact and prioritizing your response.
Step 3: Collaborate and Communicate
Keep your team and stakeholders informed throughout the process.
- Alert Impacted Teams: Based on the downstream assets you identified, proactively notify the owners of those assets (e.g., the analytics team) that the data they rely on may be compromised.
- Document your findings in the Activity Feed: Return to the Overview tab and use the Activity Feed on the right-hand panel to leave comments on your findings, actions taken, and hypotheses. This creates a clear audit trail for anyone who joins the investigation and is invaluable for future post-mortems.
Step 4: Resolve and Close the Incident
Once you've fixed the underlying issue or completed your investigation, formally close the incident in Sifflet.
Closing an incident automatically updates the qualification of all unqualified datapoints in the associated monitors, reducing the manual steps needed after resolution. Already-qualified datapoints are never overridden.
-
Click the Status button in the top-right corner of the incident page.
-
Choose a Closed status. There are three options:
Status When to use Effect on unqualified monitor datapoints Closed – Fixed The monitor correctly detected a real data issue, and your team has resolved it. No automatic qualification — the monitor's failure history is preserved. Closed – No Action Needed The alert was for a real or known issue, but no fix is required (e.g., an accepted known error). Datapoints are automatically qualified as No Action Needed / Known Error. Closed – False Positive / Expected The monitor fired incorrectly, or the underlying data behavior was expected (e.g., a planned business event). Datapoints are automatically qualified as False Positive / Expected. Other system-managed statusesA few additional closed statuses exist but are set automatically by the system — they are not selectable by users:
- Closed – Duplicate: Applied when monitors are moved to another incident.
- Closed – Monitor(s) Passing: Applied when all datapoints have been qualified and the monitors are now passing.
-
Add a closing comment (optional but recommended). When you choose a Closed status, a dialog will appear allowing you to leave a closing comment. This comment will be added to the Activity Feed and, for No Action Needed and False Positive / Expected closures, it will also be recorded as a note on the auto-qualified datapoints.
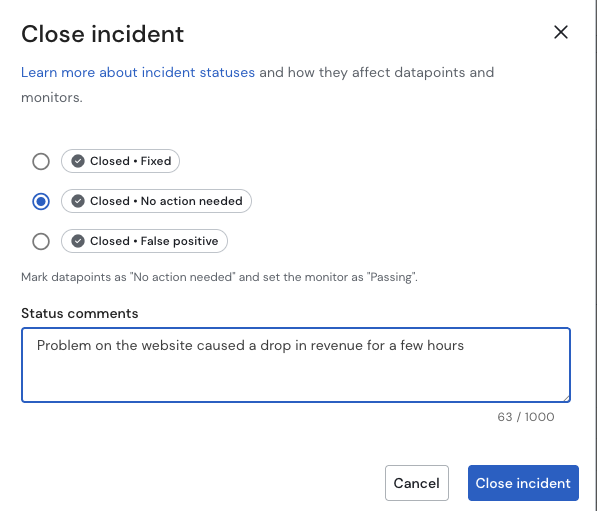
Closing an incident with a comment
Note on the "Reviewed" statusThe Closed – Reviewed status has been decommissioned. If you have historical incidents with this status, they have been automatically migrated to Closed – Fixed.
Updated 2 months ago