[Bug Fix] Sifflet Insights browser extension missing bubble
by Margot LepizzeraFixed a bug that was preventing the Sifflet Insights browser extension bubble from showing up on BI dashboard/report in some specific cases.
App version: v390
Fixed a bug that was preventing the Sifflet Insights browser extension bubble from showing up on BI dashboard/report in some specific cases.
App version: v390
You can now customize the system and domain permissions you want to grant users created through Just-In-Time (JIT) user provisioning. This addition allows for operational efficiency while minimizing risks of over-privileged accounts.
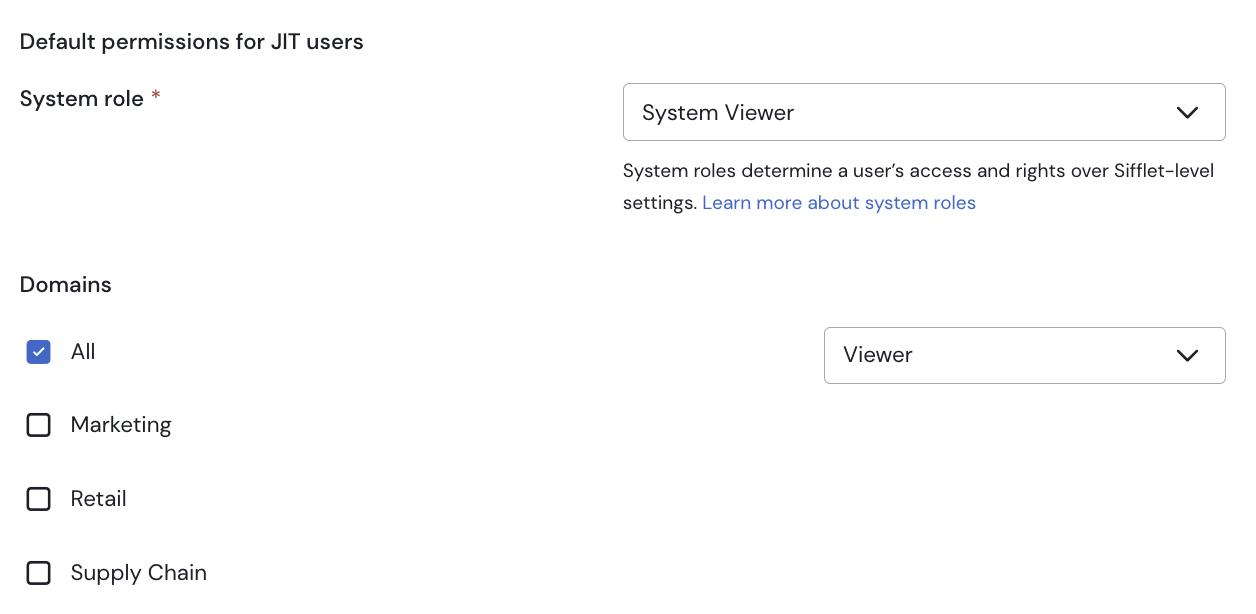
Read more about default permissions for JIT users
App version: v390
Fixed a bug that was causing page crashes when interacting with domains containing large number of assets.
App version: v387
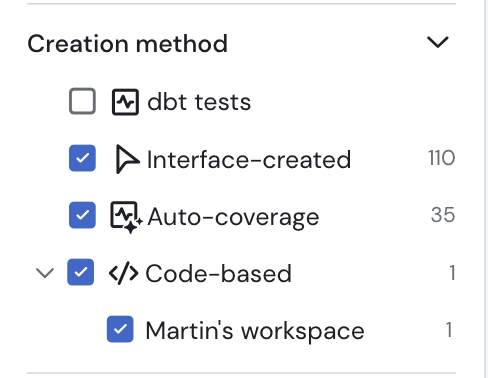
Monitors in Sifflet can be created in multiple ways, whether they come from DBT test runs, are created via the interface, or are deployed within a code-based workspace. New filters in the Monitor page allow for filtering based on these creation methods!
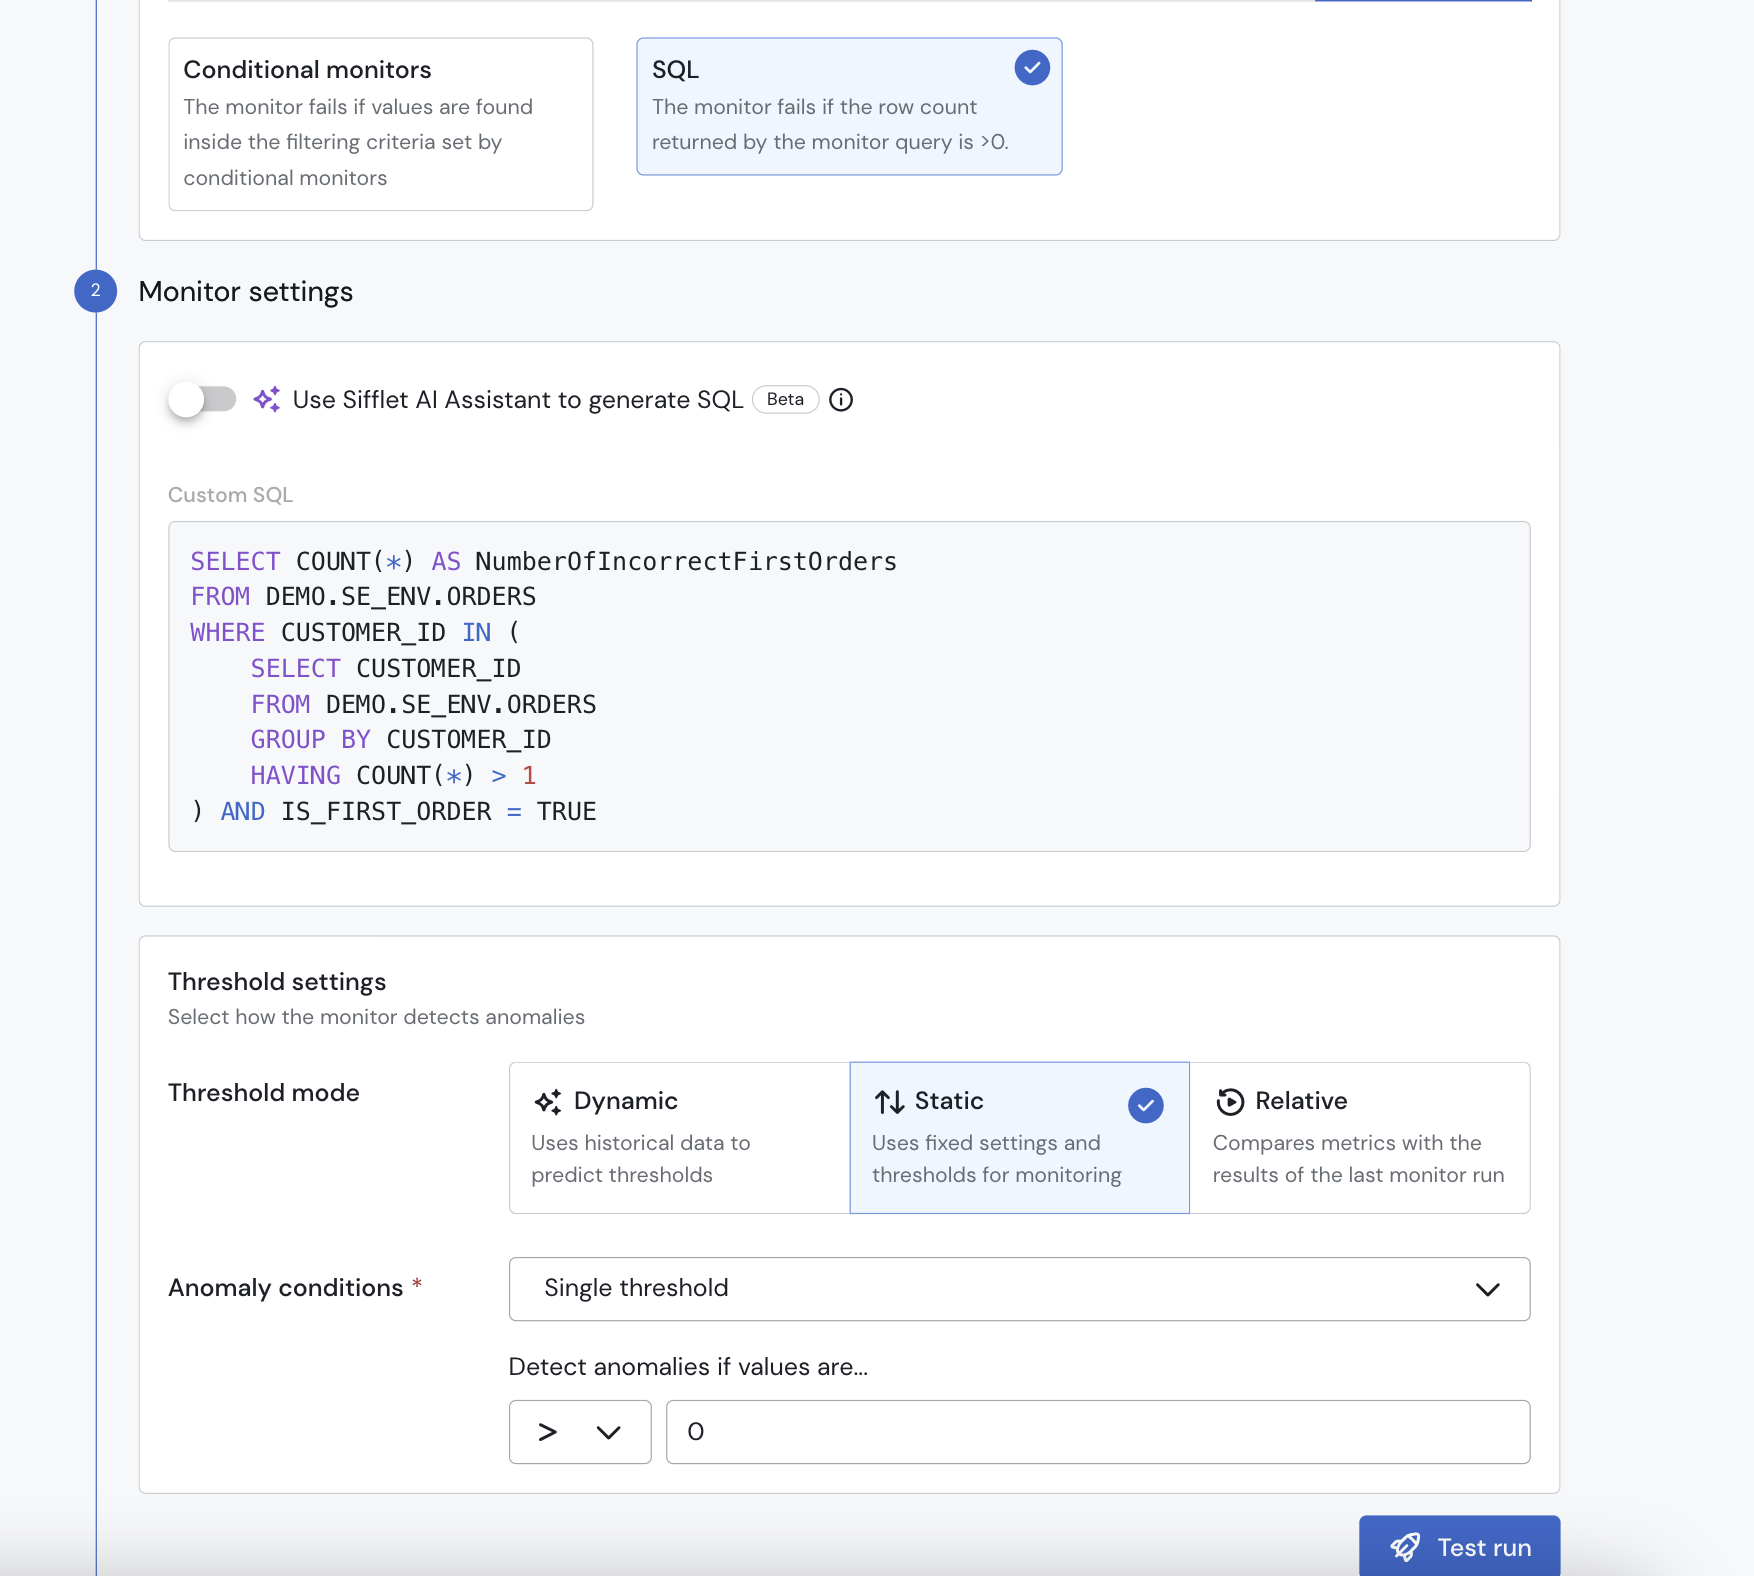
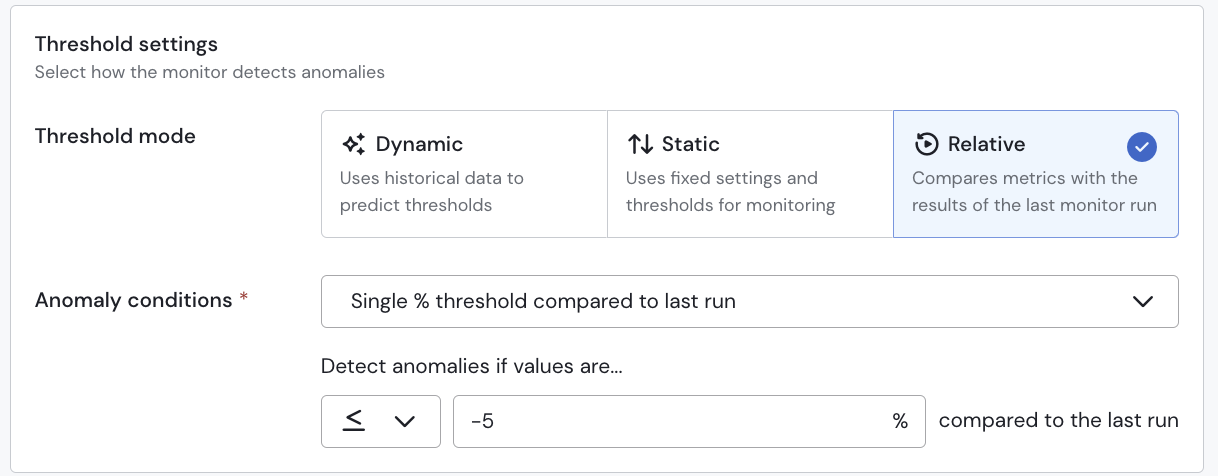
We recently added the ability to apply custom threshold settings to many monitor templates in SIfflet, we're bringing this functionality to SQL and conditional Monitors.
Rather than alert on any matching result you can now alert:
You can now use the Webhooks integration to trigger events to your endpoints in case Sifflet detects a data quality issue. This makes it possible for your teams to integrate Sifflet with virtually any collaboration tools they might be using (e.g. ServiceNow, PagerDuty, Google Chat, etc.). Incorporating data quality issues into your teams' existing tools and workflows is key to ensure streamlined and efficient operations.
Webhooks can also be leveraged for issue remediation purposes. By triggering custom scripts upon data quality issues detection, webhooks indeed allow you to decrease time to resolution by automating predefined actions (e.g. restart processes, reprocess data, or reroute workflows based on the nature of the issue).

Read more about webhooks integration
App version: v385
Sifflet prides itself on it's user friendliness, however in some scenarios you may not be sure which template to use or how to configure certain parameters. Introducing AI Monitor Suggestions!
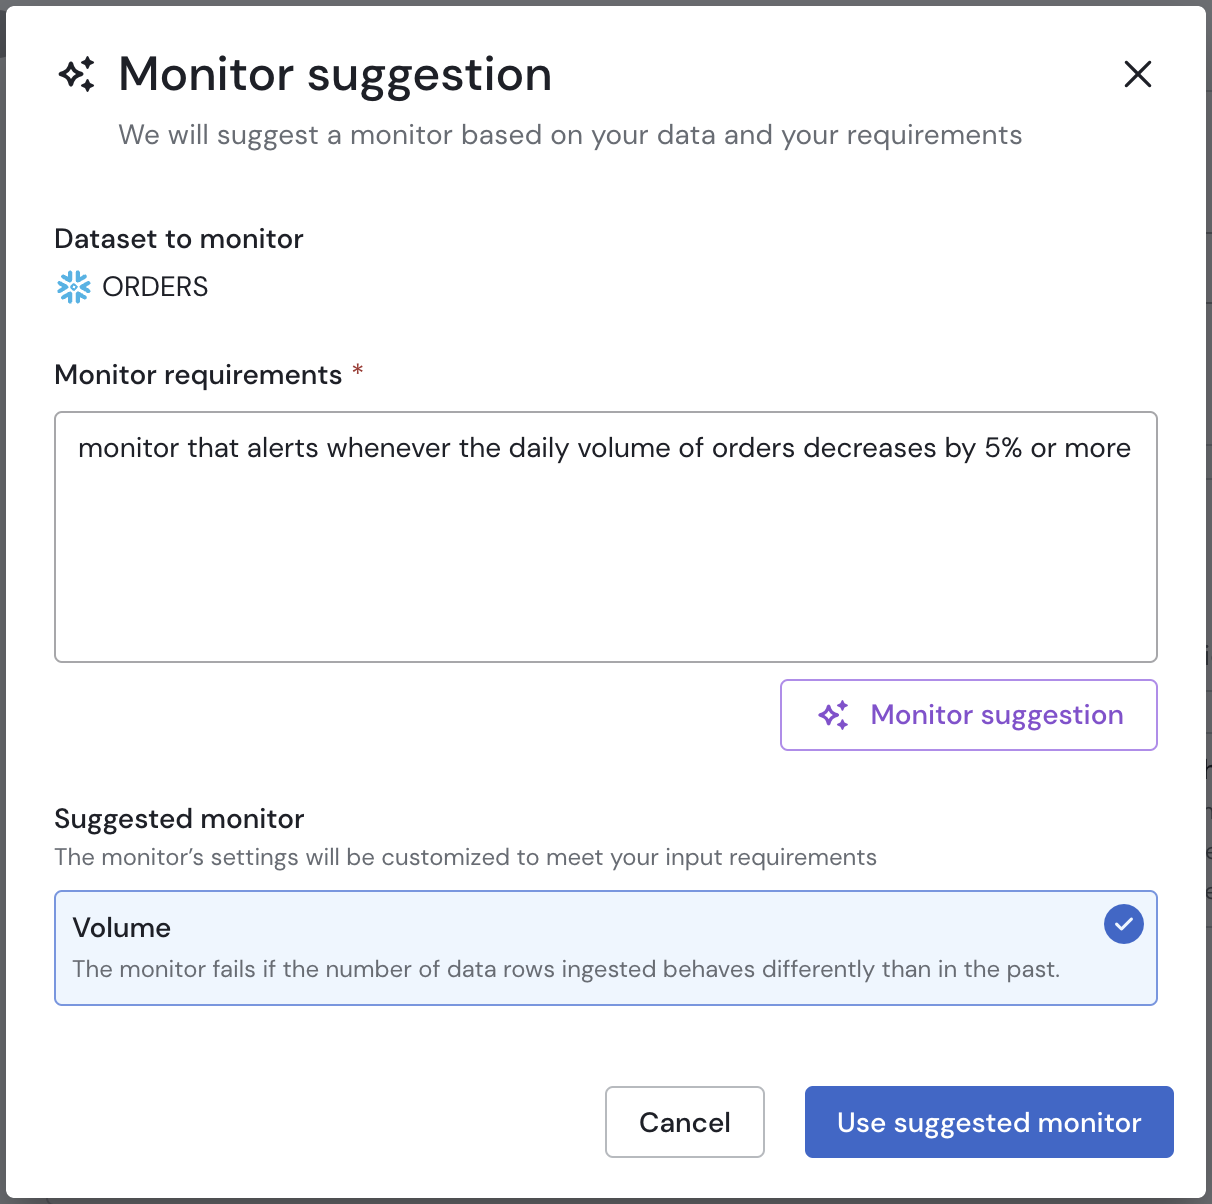
Simply describe the type of monitor you want to create and Sifflet will automatically suggest the template for you and preconfigure it based on your needs, leveraging all the context of your catalog and column descriptions!
App version: v371
When creating a new source in Sifflet, a default refresh frequency is now set based on the source type:
These default frequencies will apply to new sources, but you can still select a custom refresh frequency as needed. We also recommend updating existing sources to align with these frequencies, ensuring that metadata in Sifflet remains up-to-date.
For more details on how we categorize sources, you can refer to our integrations documentation.
App version: v371
You can now automatically create Jira issues in case of monitor failure: whenever a Sifflet incident gets created, you can decide to have a Jira issue created in the appropriate project and with the appropriate issue type. This issue will then automatically be linked to the failing monitor and corresponding incident in Sifflet.
This streamlines incident management by embedding data quality alerts directly into your existing ticketing workflows, saving valuable time and ensuring issues are never overlooked. By empowering your team with immediate visibility and prioritization of data anomalies, we’re helping you maintain data trust and operational efficiency at scale.

Read more about Jira integration
App version: v369
Increased timeout for long API calls in order to reduce the amount of 504 Gateway Timeout responses received by API clients although expected changes (e.g. declared assets and sources creation, etc.) were properly performed in Sifflet.
App version: v368
Sometimes qualifying multiple points is required, for example when tagging multiple points as false positives.
We're introducing two new ways to batch qualify.
A new "Select" Mode has now been added to graphs. allowing the qualification of multiple anomalies at once!

Select the area for which you want to qualify anomalies and hit the Qualify button
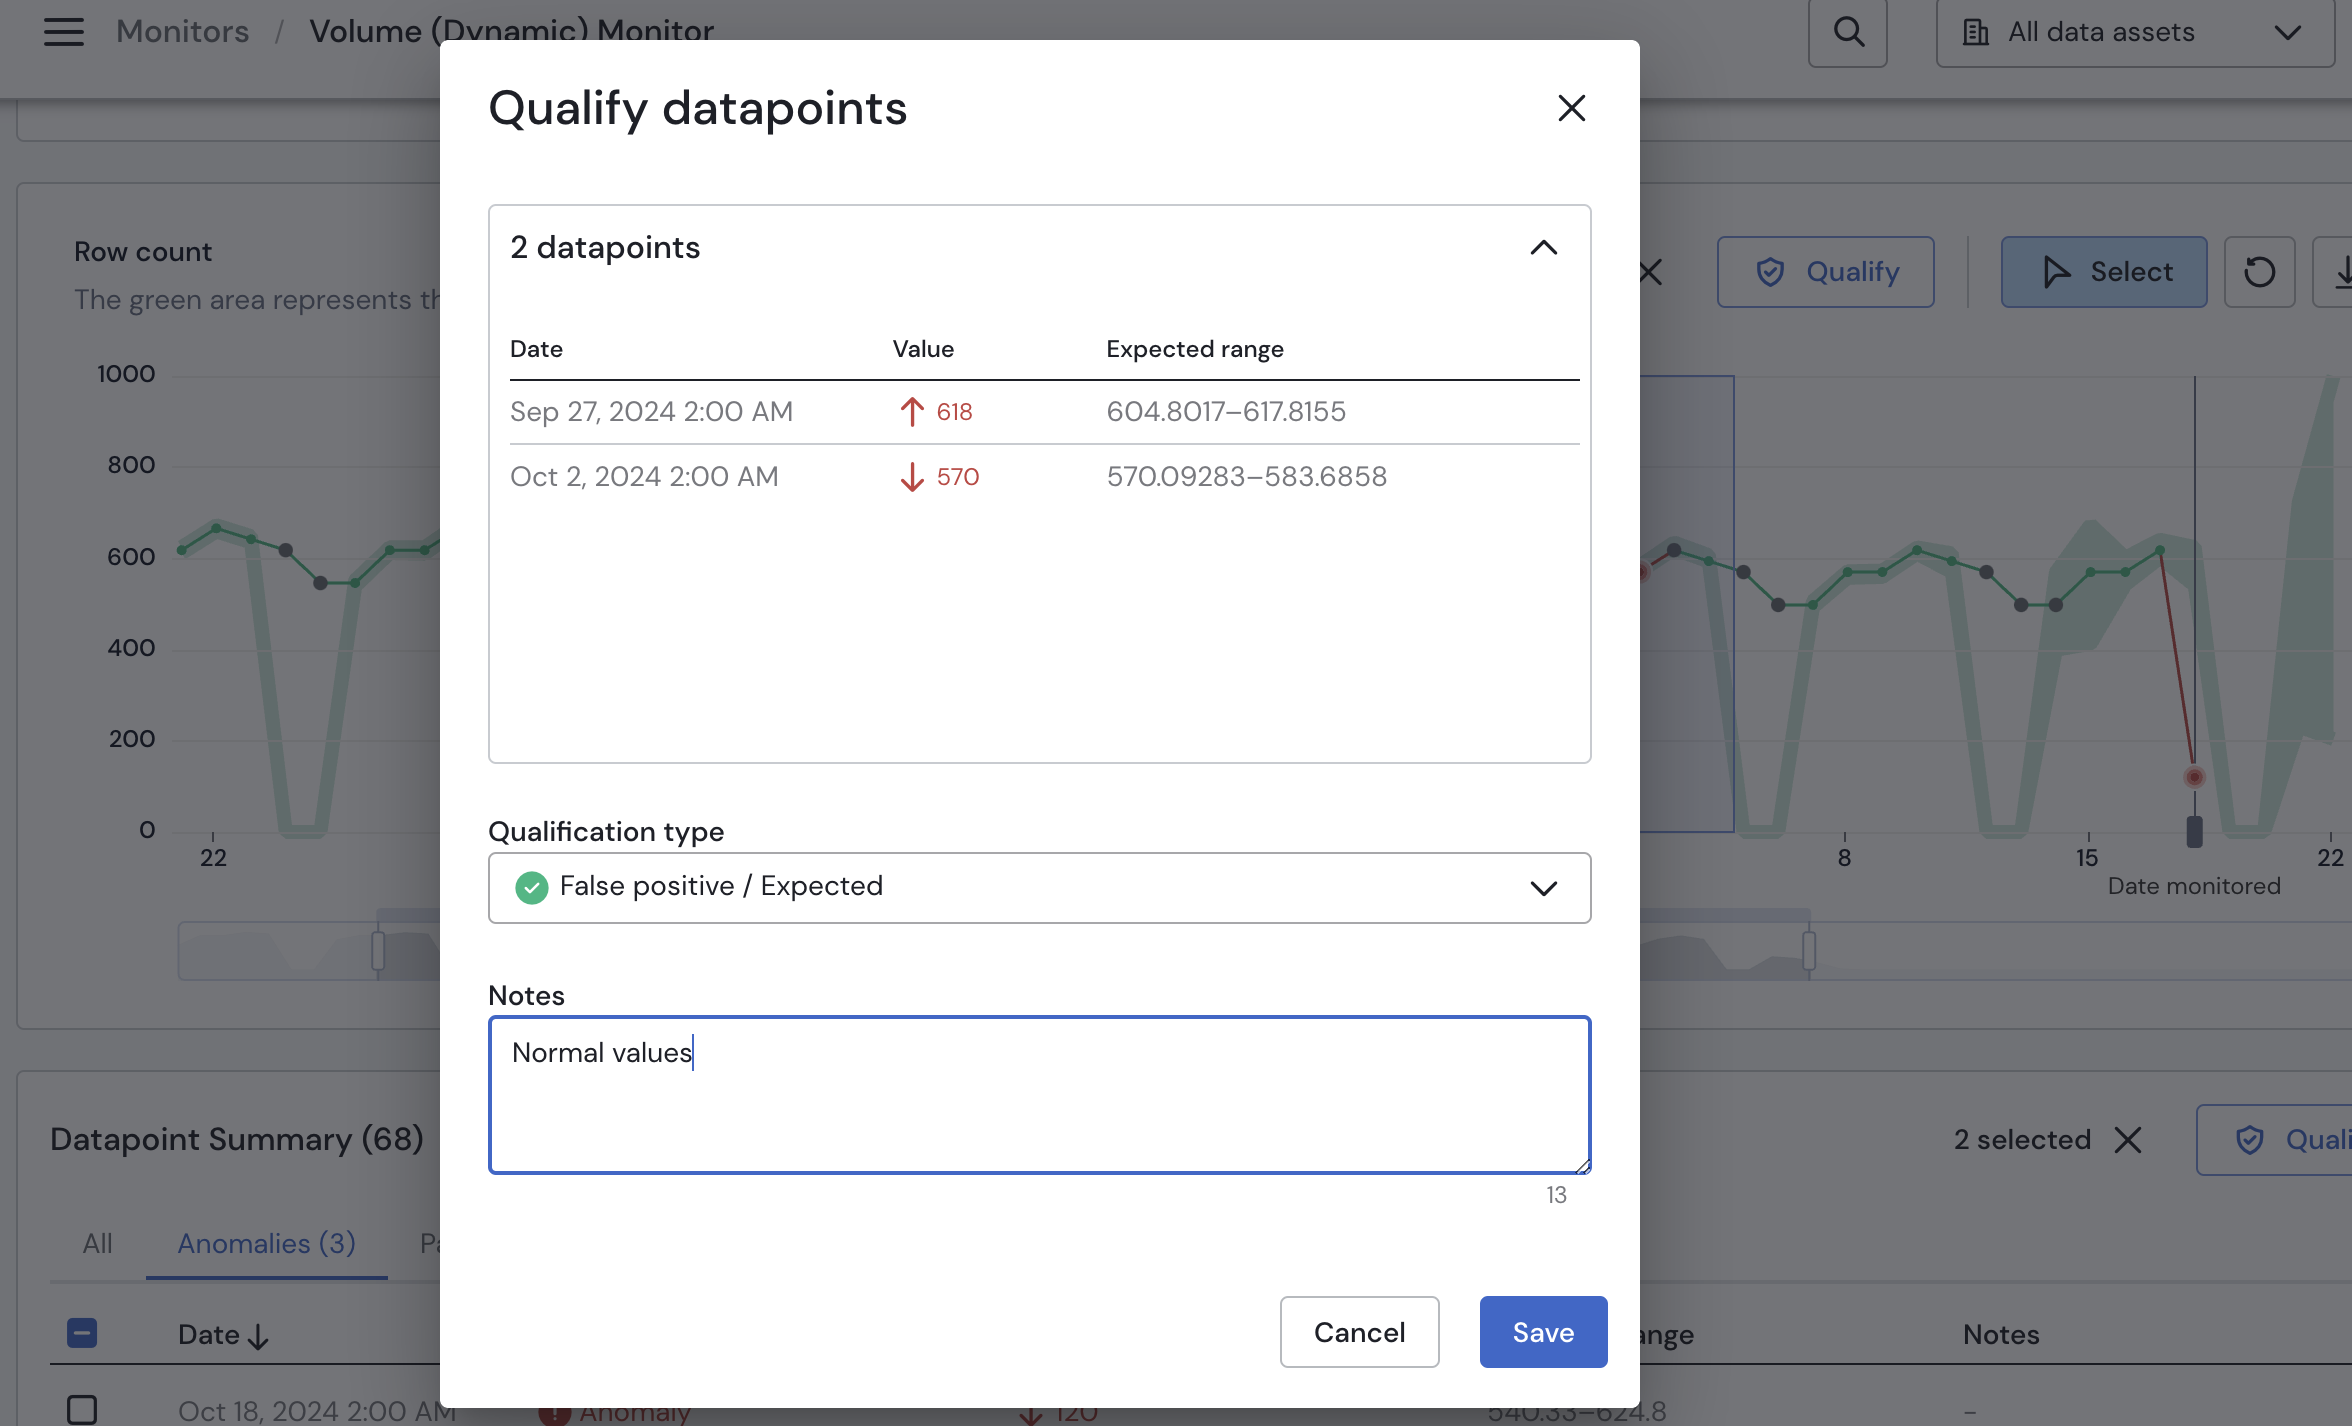
We've added a Datapoint Summary Table to allow an easy review of the unqualified anomalies
Best Practice: Treat this as an inbox of anomalies left to treat. Make good use of the "Reviewed" and "No Action Needed Qualification" to easily qualify anomalies that have been seen
