Product Release 2024-07-02
by Mahdi Karabiben✨ Feature Highlights
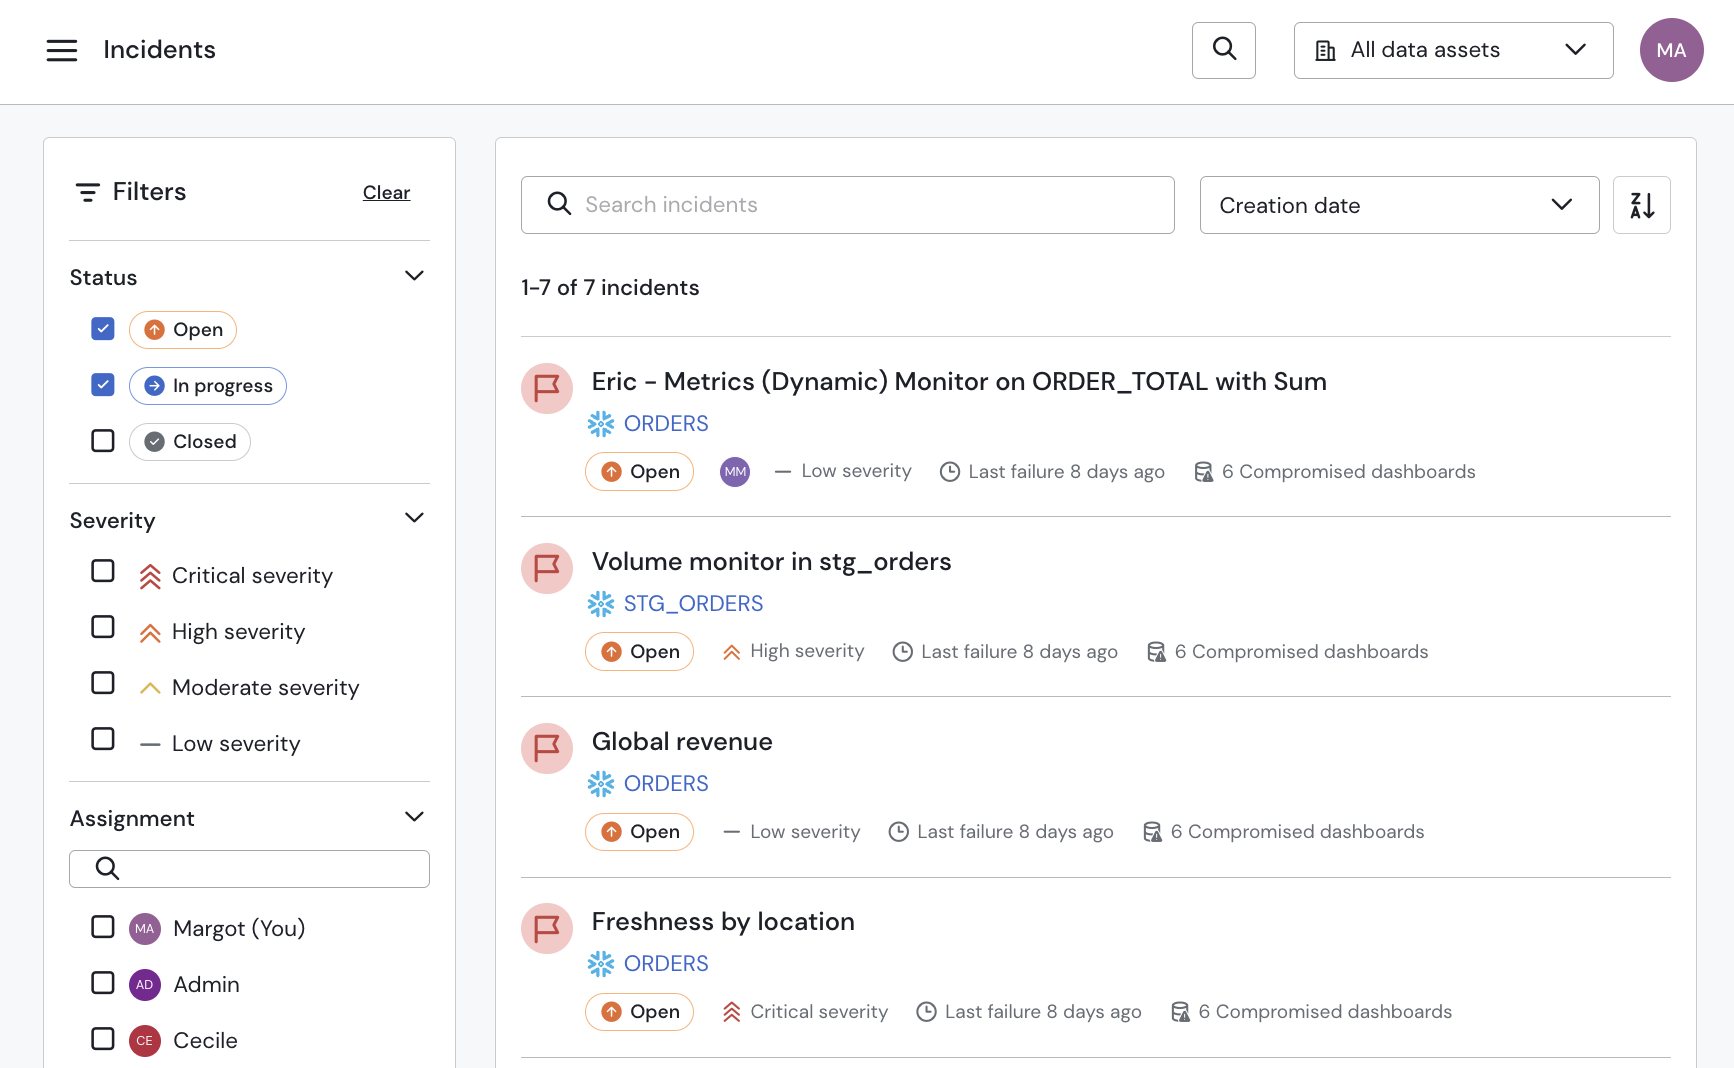
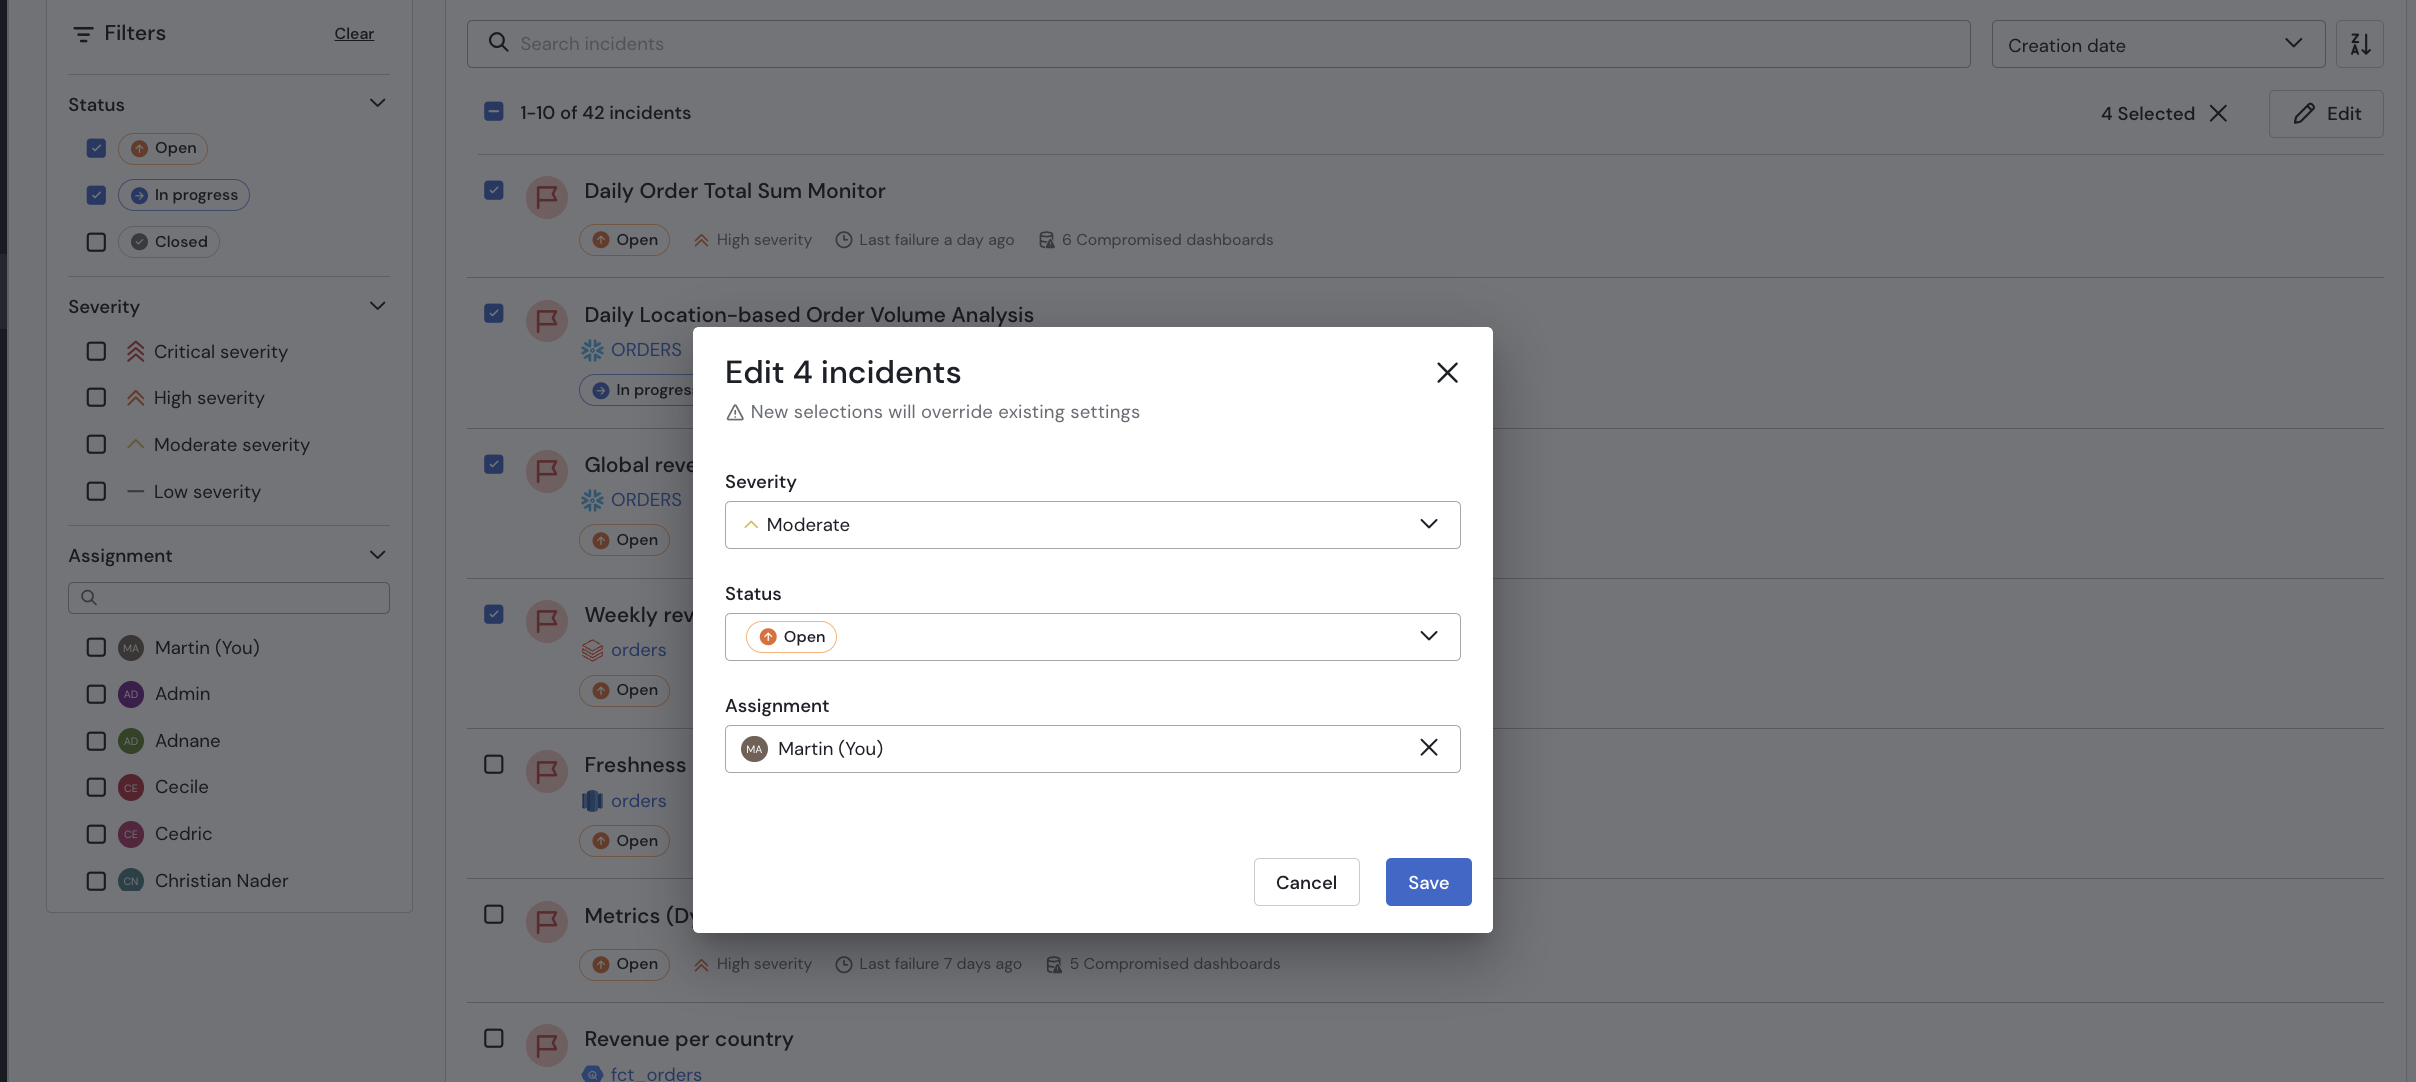
Batch Actions on Incidents
Managing Incidents is a big focus area for Sifflet at the moment as we know a lot of our customers want to manage incidents at scale! The new and improved Incident Search page allows you to now batch edit the Severity, Status and Assignments of incidents.
🔥 Improved Monitors as Code: For Loops and Templates
Many improvements to Monitors as Code today !
Alternative to Monitor UUIDs when defining monitors: friendlyId
friendlyIdBefore:
For each monitor a UUID needed to be specifiedid: 7edf1177-1a3c-4d71-b85f-e38b773735b4 which was often difficult since a UUID had to be generated outside of the yaml.
friendlyIdalternative
friendlyId is an alternate ID that only needs to be unique per dataset, this means a dataset cannot have two monitors with the same friendlyId.
kind: Monitor
version: 1
friendlyId: customerEmailUnique
datasets:
- name: sales
  datasource:
    name: mySqlDatabase
...
The above monitor has a friendlyId customerEmailUnique , only one of those monitors can be added to the sales table in our mysqlDatabase.
Alternative method to reference Datasets: URIs
Before: Referencing Datasets required knowledge of information specific to Sifflet.
Sifflet ID of dataset:
datasets:
- id: 70217023-1a89-4c0b-9b6a-c85192c918b3
Sifflet dataset name with either the id or the name of the datasource
datasets:
- name: Prices
  datasource:
    name: BigQuery Data warehouse ## OR
    id: ce3e9dd9-b007-42b0-b884-8c419f7f6daa
Now with URIs
URIs are a sifflet agnostic way to define dataset. Find out more about URIs
datasets:
- uri: snowflake://xyz12345.eu-central-1/DATABASE.SCHEMA.TABLE
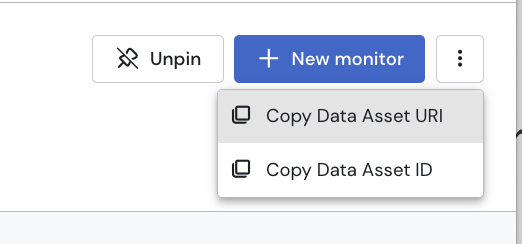
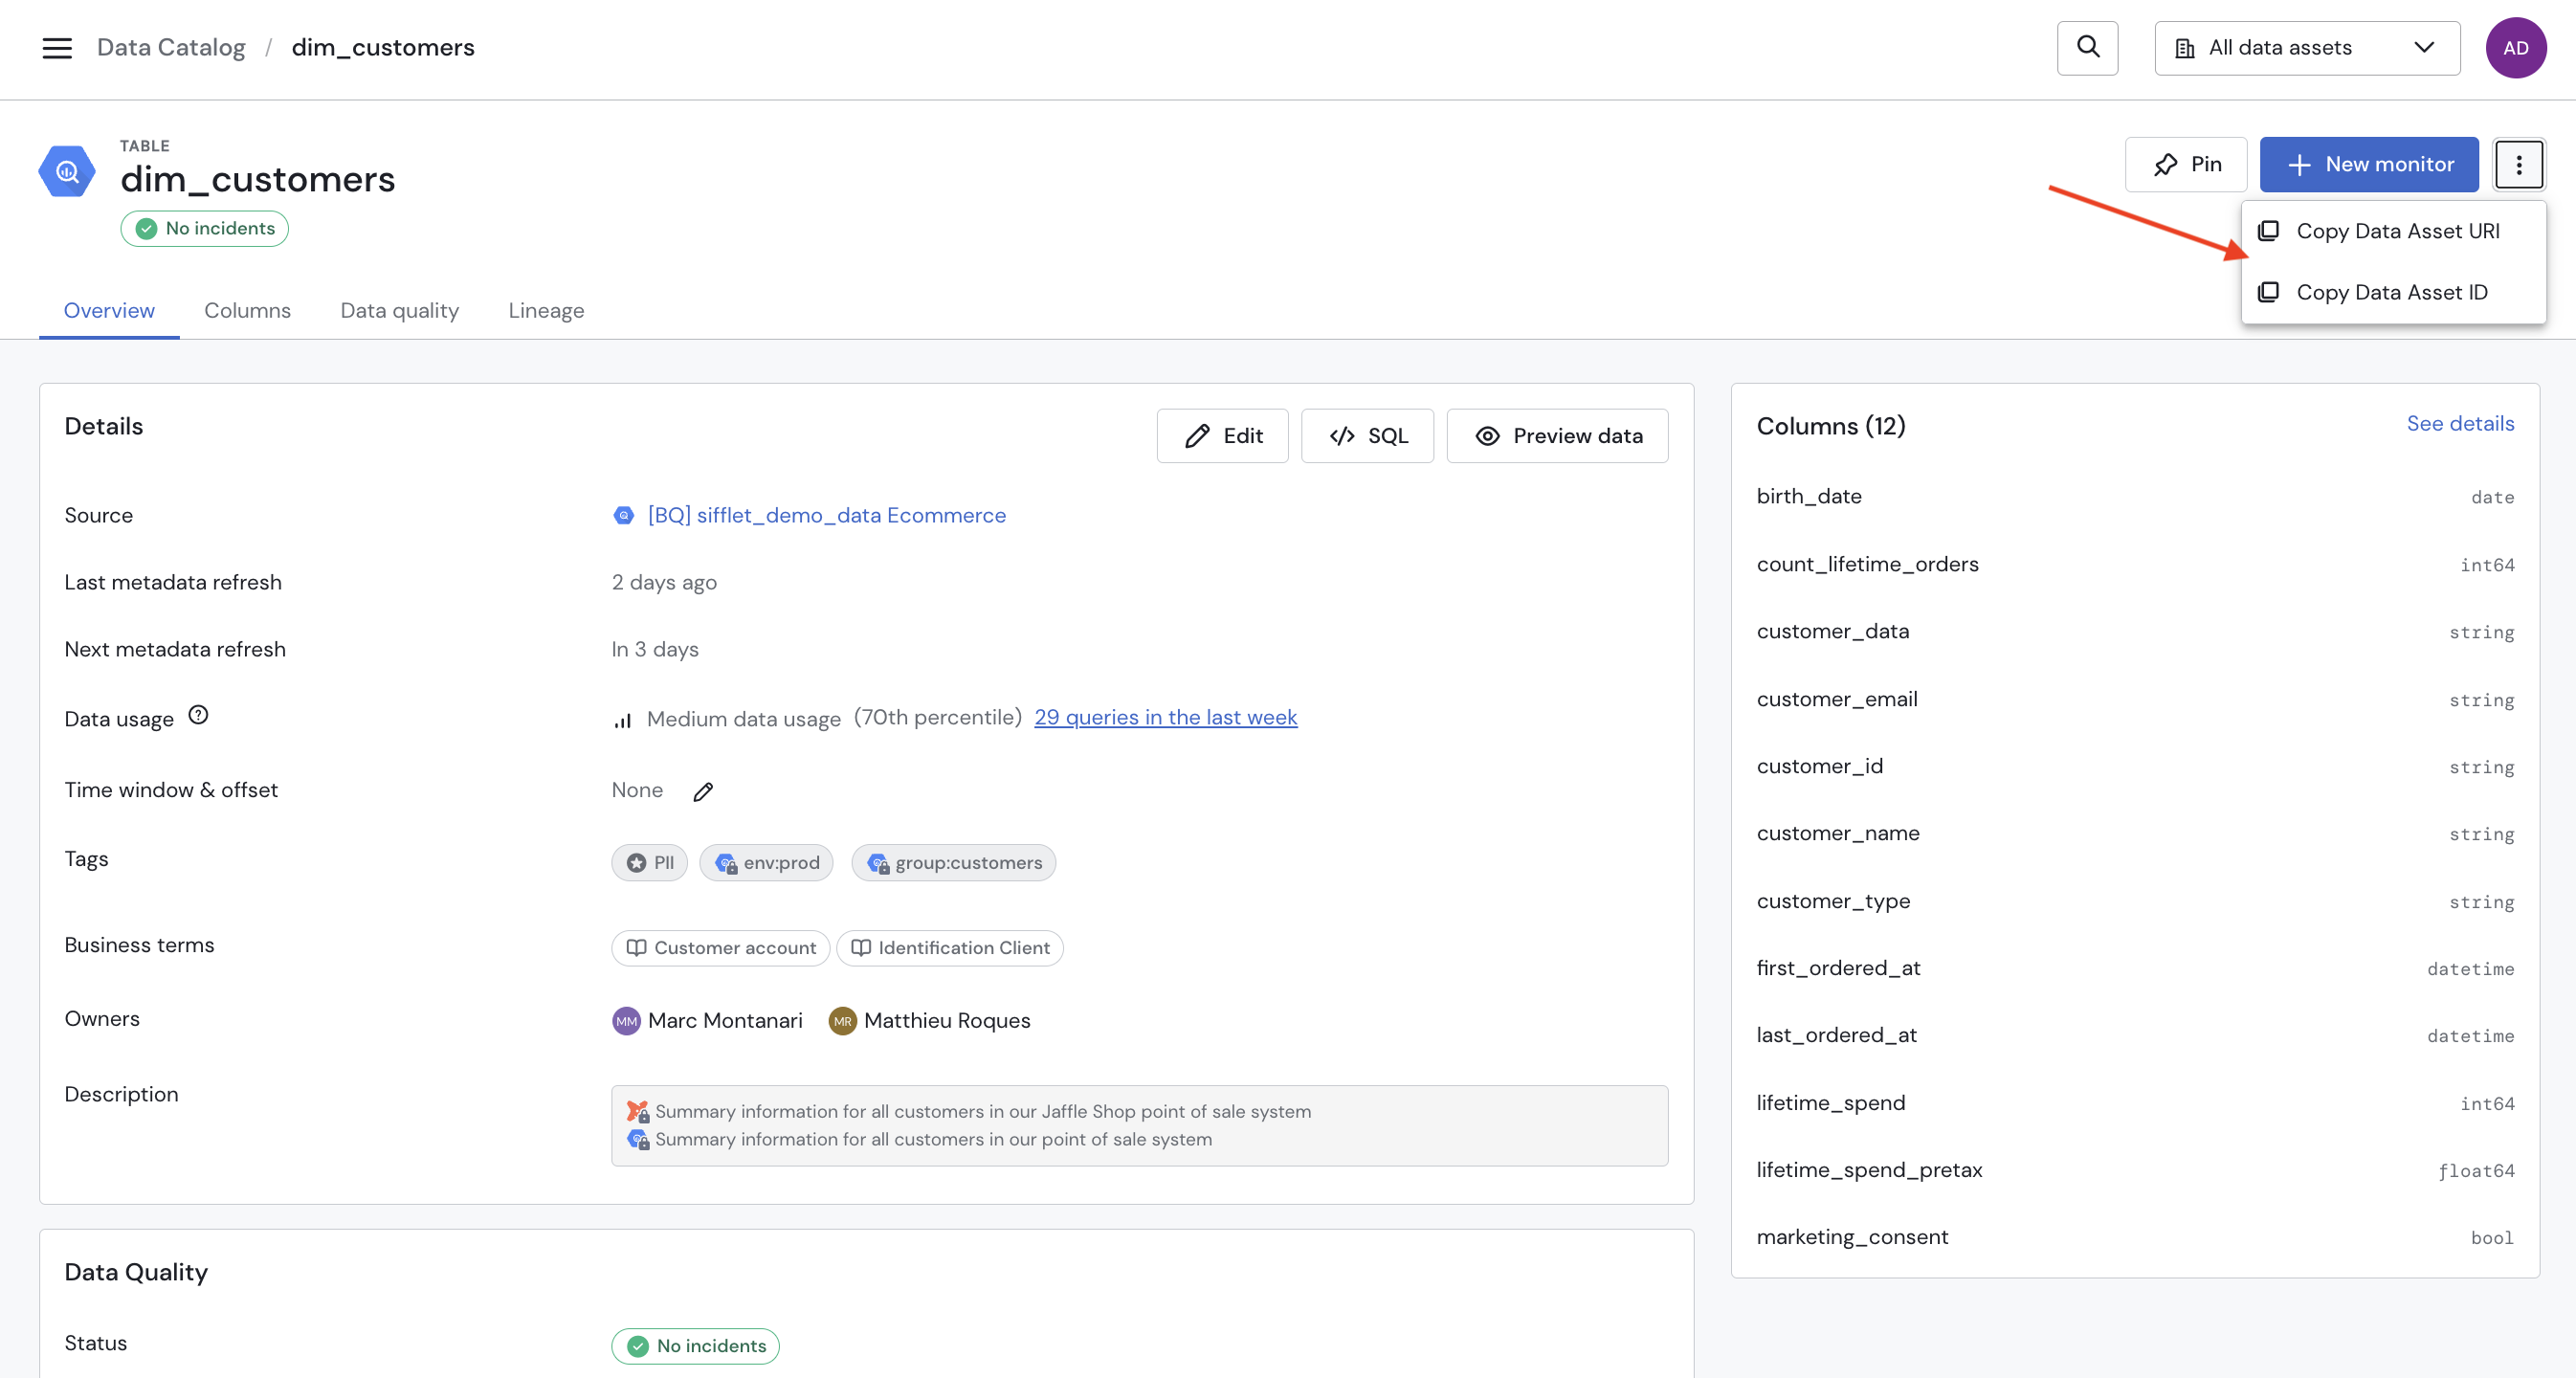
URIsYou can retrieve URIs from the Catalog's Asset Page.
Multiple Monitors Per File
Before : One file per Monitor
Now : You can now separate monitors with the --- yaml separator and have multiple monitors on the same page
kind: Monitor
version: 1
friendlyId: customer_id_format_check
name: Matches Regex Monitor on CUSTOMER_ID
...

---

kind: Monitor
version: 1
friendlyId: customer_id_duplicate_check
name: Unicity Monitor on CUSTOMER_ID
Templates
Before Each monitor definition needed to contain all the information, this meant a lot of information had to be duplicated, such as tags or alerting.
Now Templates enable the definition of parameters that can be imported into new monitor definitions
Simply define a partial (or complete ) monitor definition with a templateName
templateName: missionCriticalTags
tags:
- name: Mission Critical
notifications:
- kind: Email
  name: [email protected]
- kind: Slack
  name: Alerts
  id: dd6f06ec-fab1-4a87-9544-b113f496d61d

---

templateName: Unimportant
tags:
  - name: Unimportant
This templateName can then be extended
kind: Monitor
version: 1
friendlyId: myMonitor
name: My Monitor
extends:
- missionCriticalTags
...

---

kind: Monitor
version: 1
friendlyId: myOtherMonitor
name: My Other Monitor
extends:
- Unimportant
...
For Loops
Before Once again before each monitor had to be defined individually! However there are scenarios where I want to deploy the same monitor on multiple tables !
Now For loops allow you to define monitors on multiple tables easily !
for each dataset T:
  datasets:
  - uri: snowflake://sifflet-enterprise/DEMO.SE_ENV.ORDERS
  - uri: snowflake://sifflet-enterprise/DEMO.SE_ENV.CUSTOMERS
  - uri: snowflake://sifflet-enterprise/DEMO.SE_ENV.STG_CUSTOMERS
  monitors:
  - kind: Monitor
    version: 1
    friendlyId: customer_id_format_check
    name: "[${T.name}]Format monitor on CUSTOMER_ID"
    description: ""
    incident:
      severity: Low
      message: ""
    parameters:
      kind: FieldFormat
      field: CUSTOMER_ID
      format:
        kind: Regex
        regex: "^[0-9a-f]{8}-[0-9a-f]{4}-[0-9a-f]{4}-[0-9a-f]{4}-[0-9a-f]{12}$"

  ...
Wildcards and excludes
use include with * wildcards in your uris to apply to many datasets at the same time! then use exclude to exclude specific datasets
for each dataset T:
  datasets:
    include:
    - uri: snowflake://xyz12345.eu-central-1/DATABASE.SCHEMA.*
    - uri: bigquery:*.*.*ORDERS
    exclude:
    - uri: snowflake://xyz12345.eu-central-1/DATABASE.SCHEMA.MYTABLETOEXCLUDE
Dynamic Names
name: "[${T.name}]Format monitor on CUSTOMER_ID"
Use ${T.name} to reference the name of your table.
🛠 Fixes
- Fixed an issue where Sifflet pages would require a manual refresh to operate as expected after a new release
- Fixed an issue where in some instances, a recently edited user could not be saved
- Fixed an issue where some domains would not show up in the permissions modal.
App version: v279-281

