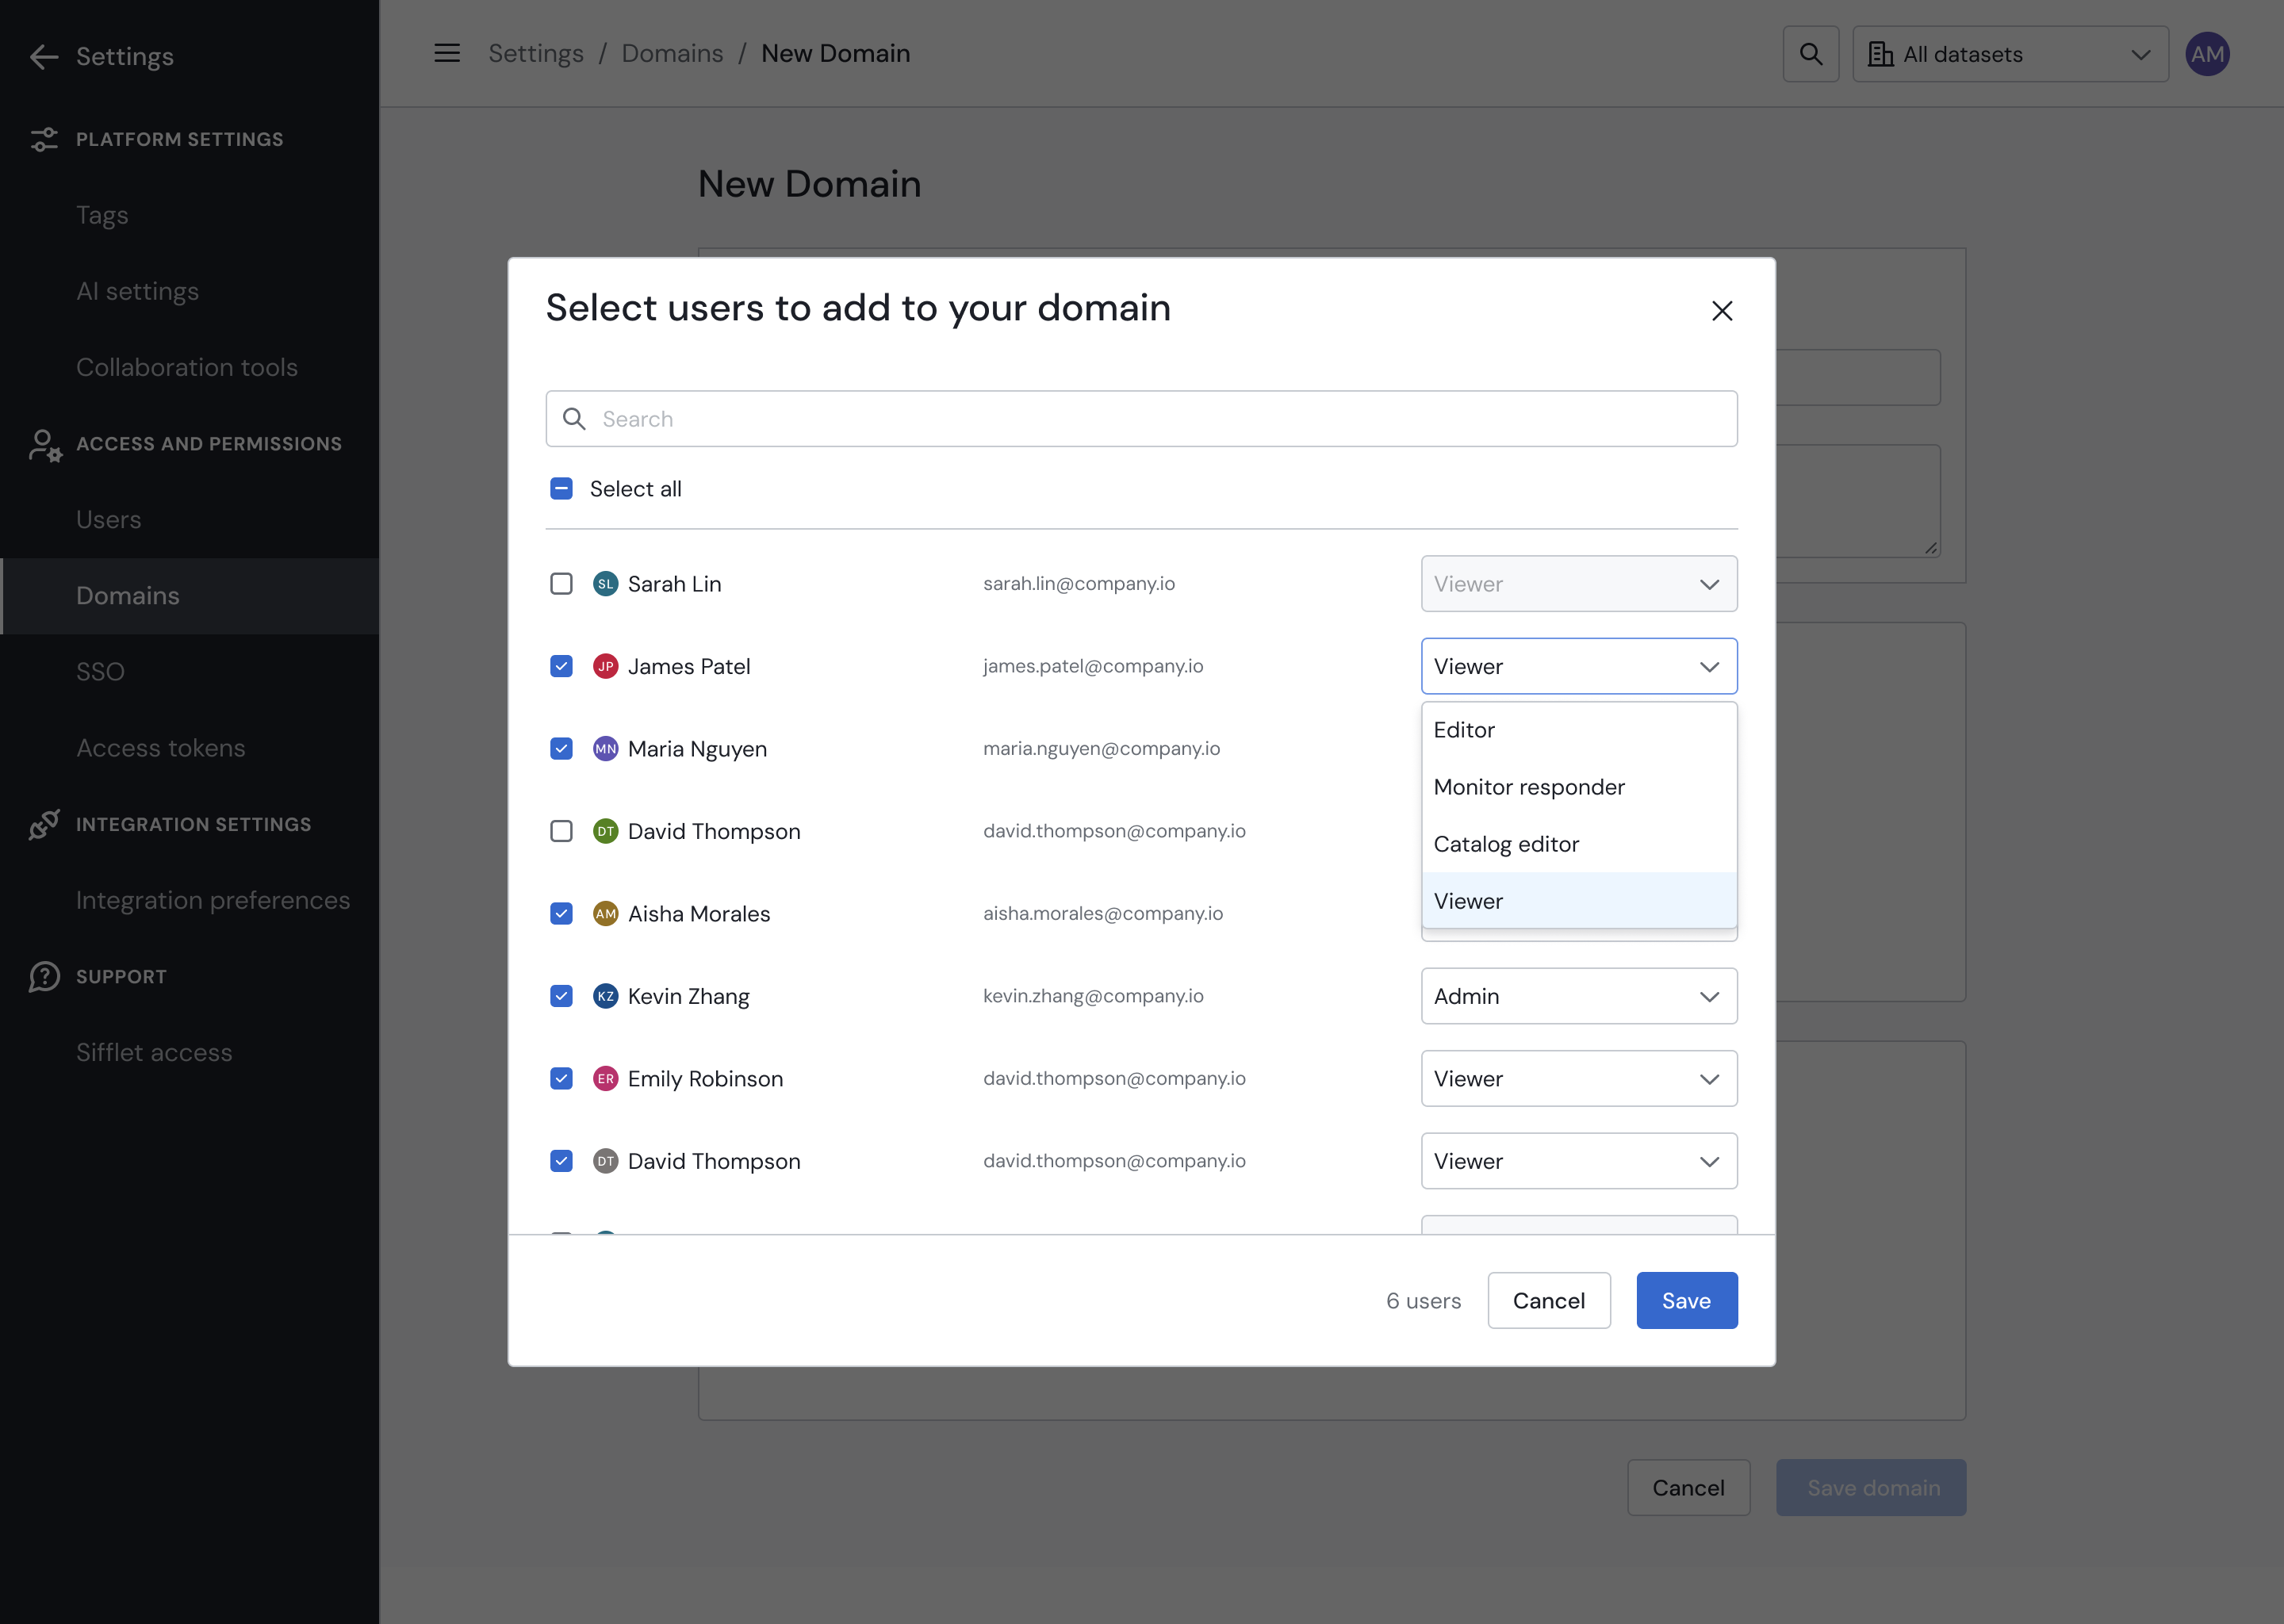
The Filter conditions method now supports the OR operator between conditions when creating a domain. This enhances flexibility by allowing you to define domains containing assets that either come from specific sources or are tagged with a specific tag or label.

Read more about domains

App version: v433

There are two scenarios for monitors going from Failing to Passing

  • Monitors that scan the entire table: When the last run of the monitor succeeds the monitor will change status to Passing because the entire table has been scanned and the anomaly is not present anymore.
    i.e. A monitor detected 50% null values on a column, and the next run detects 0% null values, the problem has been fixed.
  • Incremental Monitors: Incremental monitors require human interaction to go from failing to passing, by qualifying all the anomalies. Why is the behaviour different? because a successful run on an incremental monitor does not mean the issue has been resolved. For example if there were null values in yesterday's data, but there are none in today's data, there is nothing that suggests yesterday's data has been fixed.

We recently introduced Dynamic Monitor Statuses , allowing monitors to change their status based on qualifications made by the user.

A new flow will now ensure that qualifying a monitor to make it passing will now close the incident associated automatically.

Step 1: Qualify a Monitor as Passing

Step 1: Qualify a Monitor as Passing

When qualifying a monitor as passing, either via manually qualifying points or by using the global monitor Qualify as passing option, this will now propagate to the incident.

Note: An incident with multiple monitors will only close automatically if all the monitors are passing!

๐Ÿ“˜

Coming Soon

Closing an incident will currently not propagate to monitors, this is coming soon !

Automatically Monitoring Tables is being simplified. The new Automatic Monitoring configuration will ensure you can cover entire schemas or databases with default monitoring!

The Following monitors can be applied automatically:

Freshness (Metadata): Dynamically alerts if the time since the last update

Volume (Full Table Scan): Dynamically Alerts if the total number of rows in the table diverges from its usual norm.

Schema Change: Alerts if the schema changes, such as a column dropping from a table.

All these monitors will only be created on Tables and will query metadata so they should all be pretty much Free to run on your warehouse !

To access this feature navigate to our new Settings Menu and to the Automatic Monitoring section

Note: New tables added to the activated schemas will automatically be monitored when detected by Sifflet.


Created Monitors can easily be filtered on via the Creation Method Filter of the Monitors page:


This feature is in Beta:

  • Currently limited to 1000 monitored datasets
  • Will allow selection of dataset types other than Tables in the future, such as Views ( impacting the query cost on the warehouse )
  • Subject to monitor availability on the technology: i.e. Metadata Freshness only available on select Technologies.

Ensuring Sifflet sources successfully run is critical to ensure your metadata is always up-to-date. You can now get alerted on failing source runs, making it easy to promptly react in case Sifflet is no longer able to pull metadata from your data stack because of an authorization issue, a connectivity problem or anything else.

Read more about the Notify on source failure setting

App version: v424

Weโ€™re excited to introduce a new set of API endpoints for assets, allowing you to programmatically interact with your data catalog. These endpoints allow you to search, discover, and update catalog assets and build any relevant automation around that:

  • Programmatically update and enrich your Sifflet assets with technical and business context coming from third party tools (e.g. data catalogs, knowledge management tools, etc.)
  • Build custom reports on your assets, their health, owners, and any dimension relevant to your use case.

Read more about assets API endpoints

App version: v421

Redshift Serverless Support

by Mahdi Karabiben

We're excited to announce that Sifflet now seamlessly integrates with Amazon Redshift Serverless! This means you can now leverage Sifflet's powerful data observability capabilities for your serverless Redshift instances, unlocking actionable insights into your data pipelines and ensuring data quality at scale.

End-to-end lineage for Redshift Serverless is coming soon, but you can already leverage our dbt integration or our declarative lineage framework for immediate lineage visibility.

App version: v421

Sifflet's Data Sharing feature has been enhanced with a new Transformations table. This table offers comprehensive metadata on all transformations cataloged in Sifflet, including dbt models, Fivetran syncs, and more. The table also provides the necessary join keys to connect each transformation to the dataset(s) it produces.