Impact: response payload of the following endpoints
Get list of users: GET https://{tenant}.siffletdata.com/api/v1/users
Create a user: POST https://{tenant}.siffletdata.com/api/v1/users
Update a user: PATCH https://{tenant}.siffletdata.com/api/v1/users/{id}
Get a user by id: GET https://{tenant}.siffletdata.com/api/v1/users/{id}
The response payload for those endpoints contains a new property named status indicating if a user is enabled or disabled. This property is represented as an enum string with two possible values: ENABLED and DISABLED.
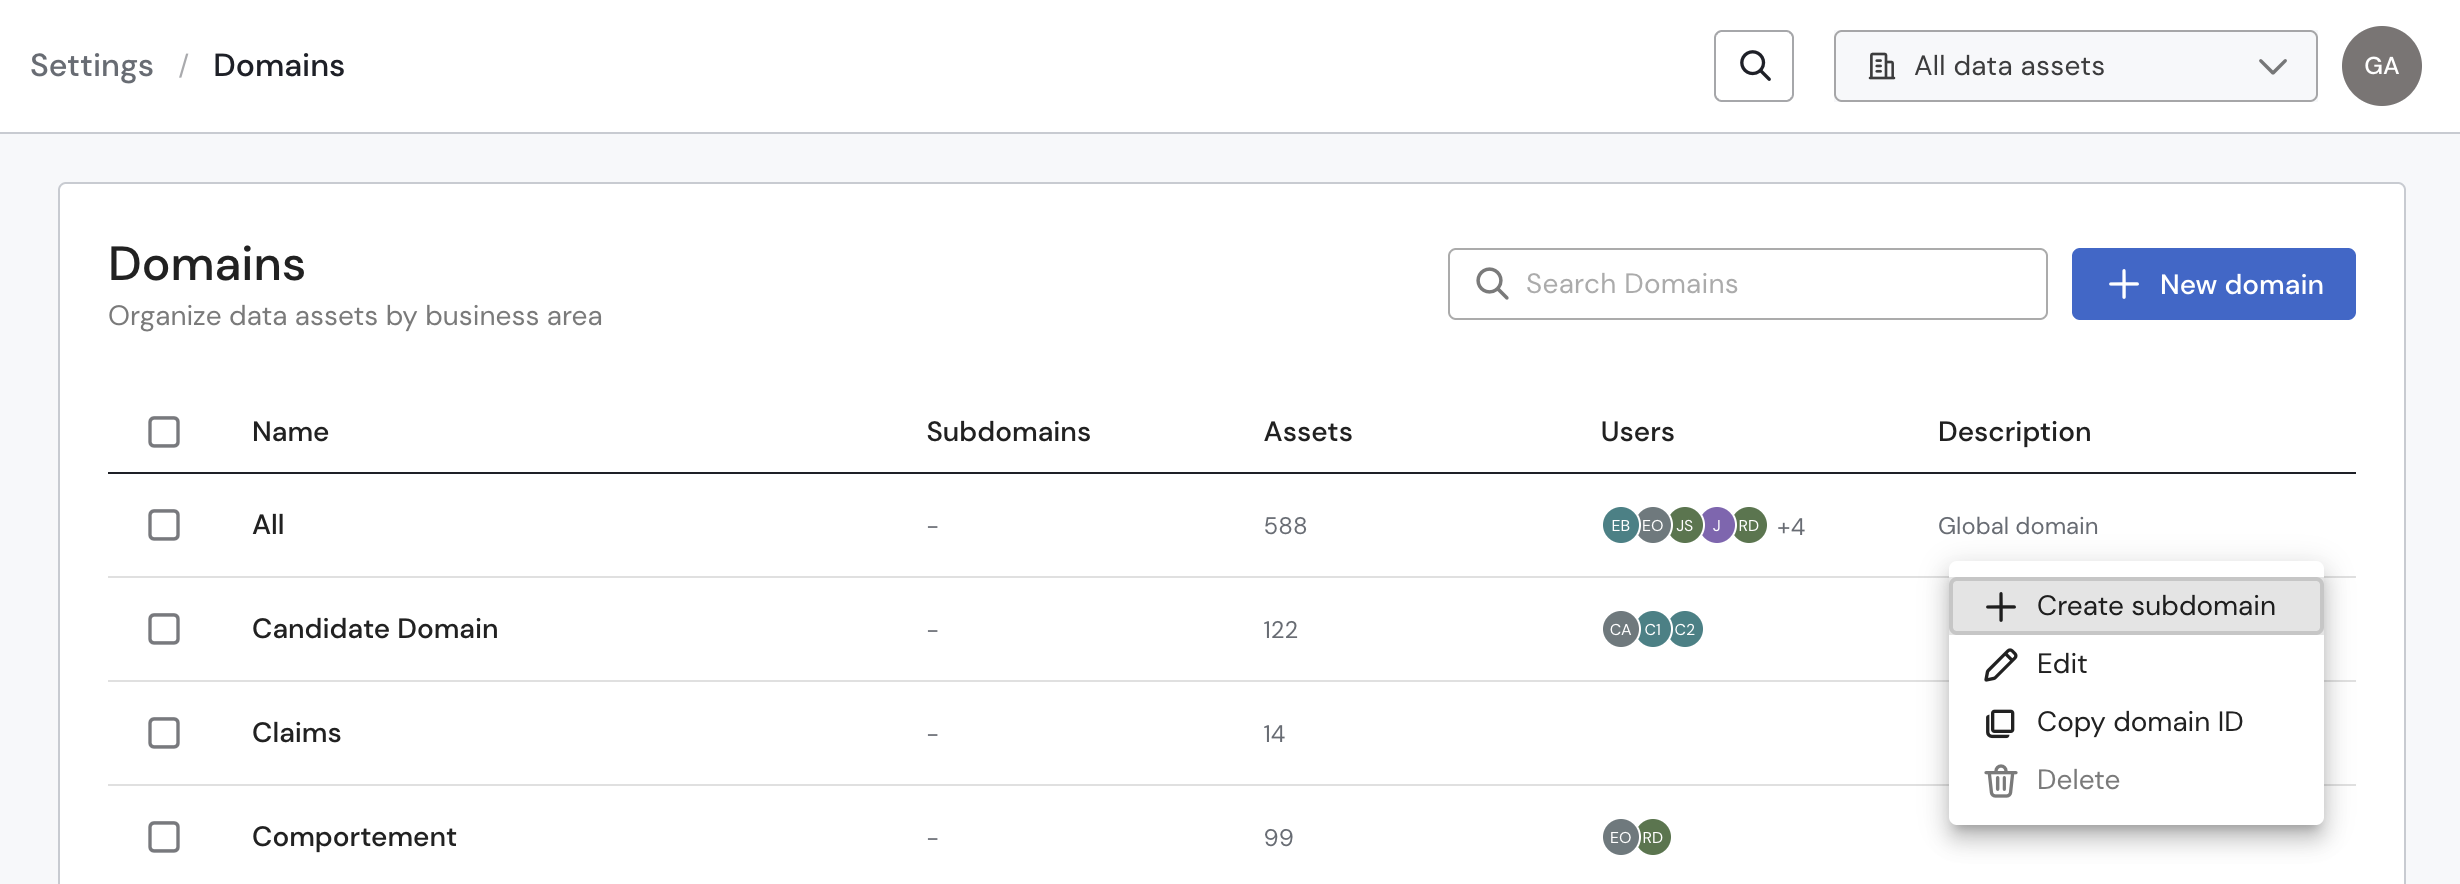
We're excited to introduce a major enhancement to your security and access management: role-based domain control for Access Tokens.
This update gives you a new level of precision, allowing you to assign each token to one or more specific domains. You can then grant, for each domain, one of four distinct domain-level roles: Viewer, Editor, Catalog Editor, or Monitor Responder.
This ensures that every token operates on the principle of least privilege, granting only the exact permissions needed. The result is a more secure, flexible, and manageable system for your entire team.
Role-Based Domain Control
What about my existing tokens?
For a seamless transition, your existing Access Tokens will continue to function as they do today, with access to all domains. You can now edit any of these tokens at your convenience to restrict their access to specific domains and assign them a precise role.
We've enhanced our debugging capabilities for incremental monitors. Previously, the "Show Failing Rows" button provided a view of the failing rows for the latest monitor run. Now, the feature is datapoint-specific.
This means you can select any point from a monitor's execution history and see the exact rows that caused a failure for that specific time and execution. This makes it much easier to investigate if a problem from a past run has been resolved or to analyze a specific incident in isolation.
We're thrilled to announce a fundamental redesign of how sources are managed in Sifflet. We've transitioned from a schema-by-schema approach to a unified, environment-level model. This update streamlines the user experience, provides a more accurate representation of your data landscape, and introduces powerful new tools for managing and troubleshooting your integrations.
Sifflet's new source management page
✨ New Features & Major Improvements
Environment-Level Sources: Sources are now managed at the environment level. For example, your entire Snowflake account or BigQuery project is now represented as a single, consolidated source in Sifflet. Your existing sources have been automatically migrated to this new structure.
New Source Details Modal: Clicking on any source name now opens a powerful details modal. This new view provides a granular breakdown of all the schemas within that source and their individual statuses.
Granular Metadata Refresh: You now have precise control over what you refresh. Alongside the main "Run" button for a full source sync, you can now trigger refreshes for specific schemas or databases directly from within the new details modal.
Streamlined Failure Resolution: Troubleshooting connection issues is now faster than ever. The Source Details modal includes:
A "Failures" Tab: This view automatically lists only the schemas that failed to sync, so you can immediately see what needs attention.
"Rerun All Failures" Button: Trigger a targeted refresh for all failed items with a single click.
Per-Schema Logs: A "Logs" button appears next to each failed schema, giving you instant access to detailed error messages to diagnose the root cause.
Official Source Merging Process: We've introduced a clear, safe process for consolidating multiple sources into a single primary source—perfect for cleaning up your setup after the migration. Sifflet seamlessly maps all monitors and assets during the merge, ensuring no loss of data or observability.
🗒️ For API & Terraform Users
API Deprecation: Please be aware that the legacy API endpoint used for managing schema-level sources is now deprecated and will be decommissioned in a future release.
New API Endpoint: A new, more powerful API endpoint for managing environment-level sources is now available. We strongly encourage you to migrate your scripts and Terraform configurations to use the new endpoint. Please refer to our API documentation for full details.
We are confident these changes will make managing your data integrations in Sifflet a much more intuitive and efficient experience. For additional details on the new source management experience, refer to the dedicated documentation page.
We’re excited to announce a new Pipeline Alerting feature to help you proactively monitor the health of your data pipelines. This feature is currently available for dbt integrations, with support for Airflow and Fivetran coming soon.
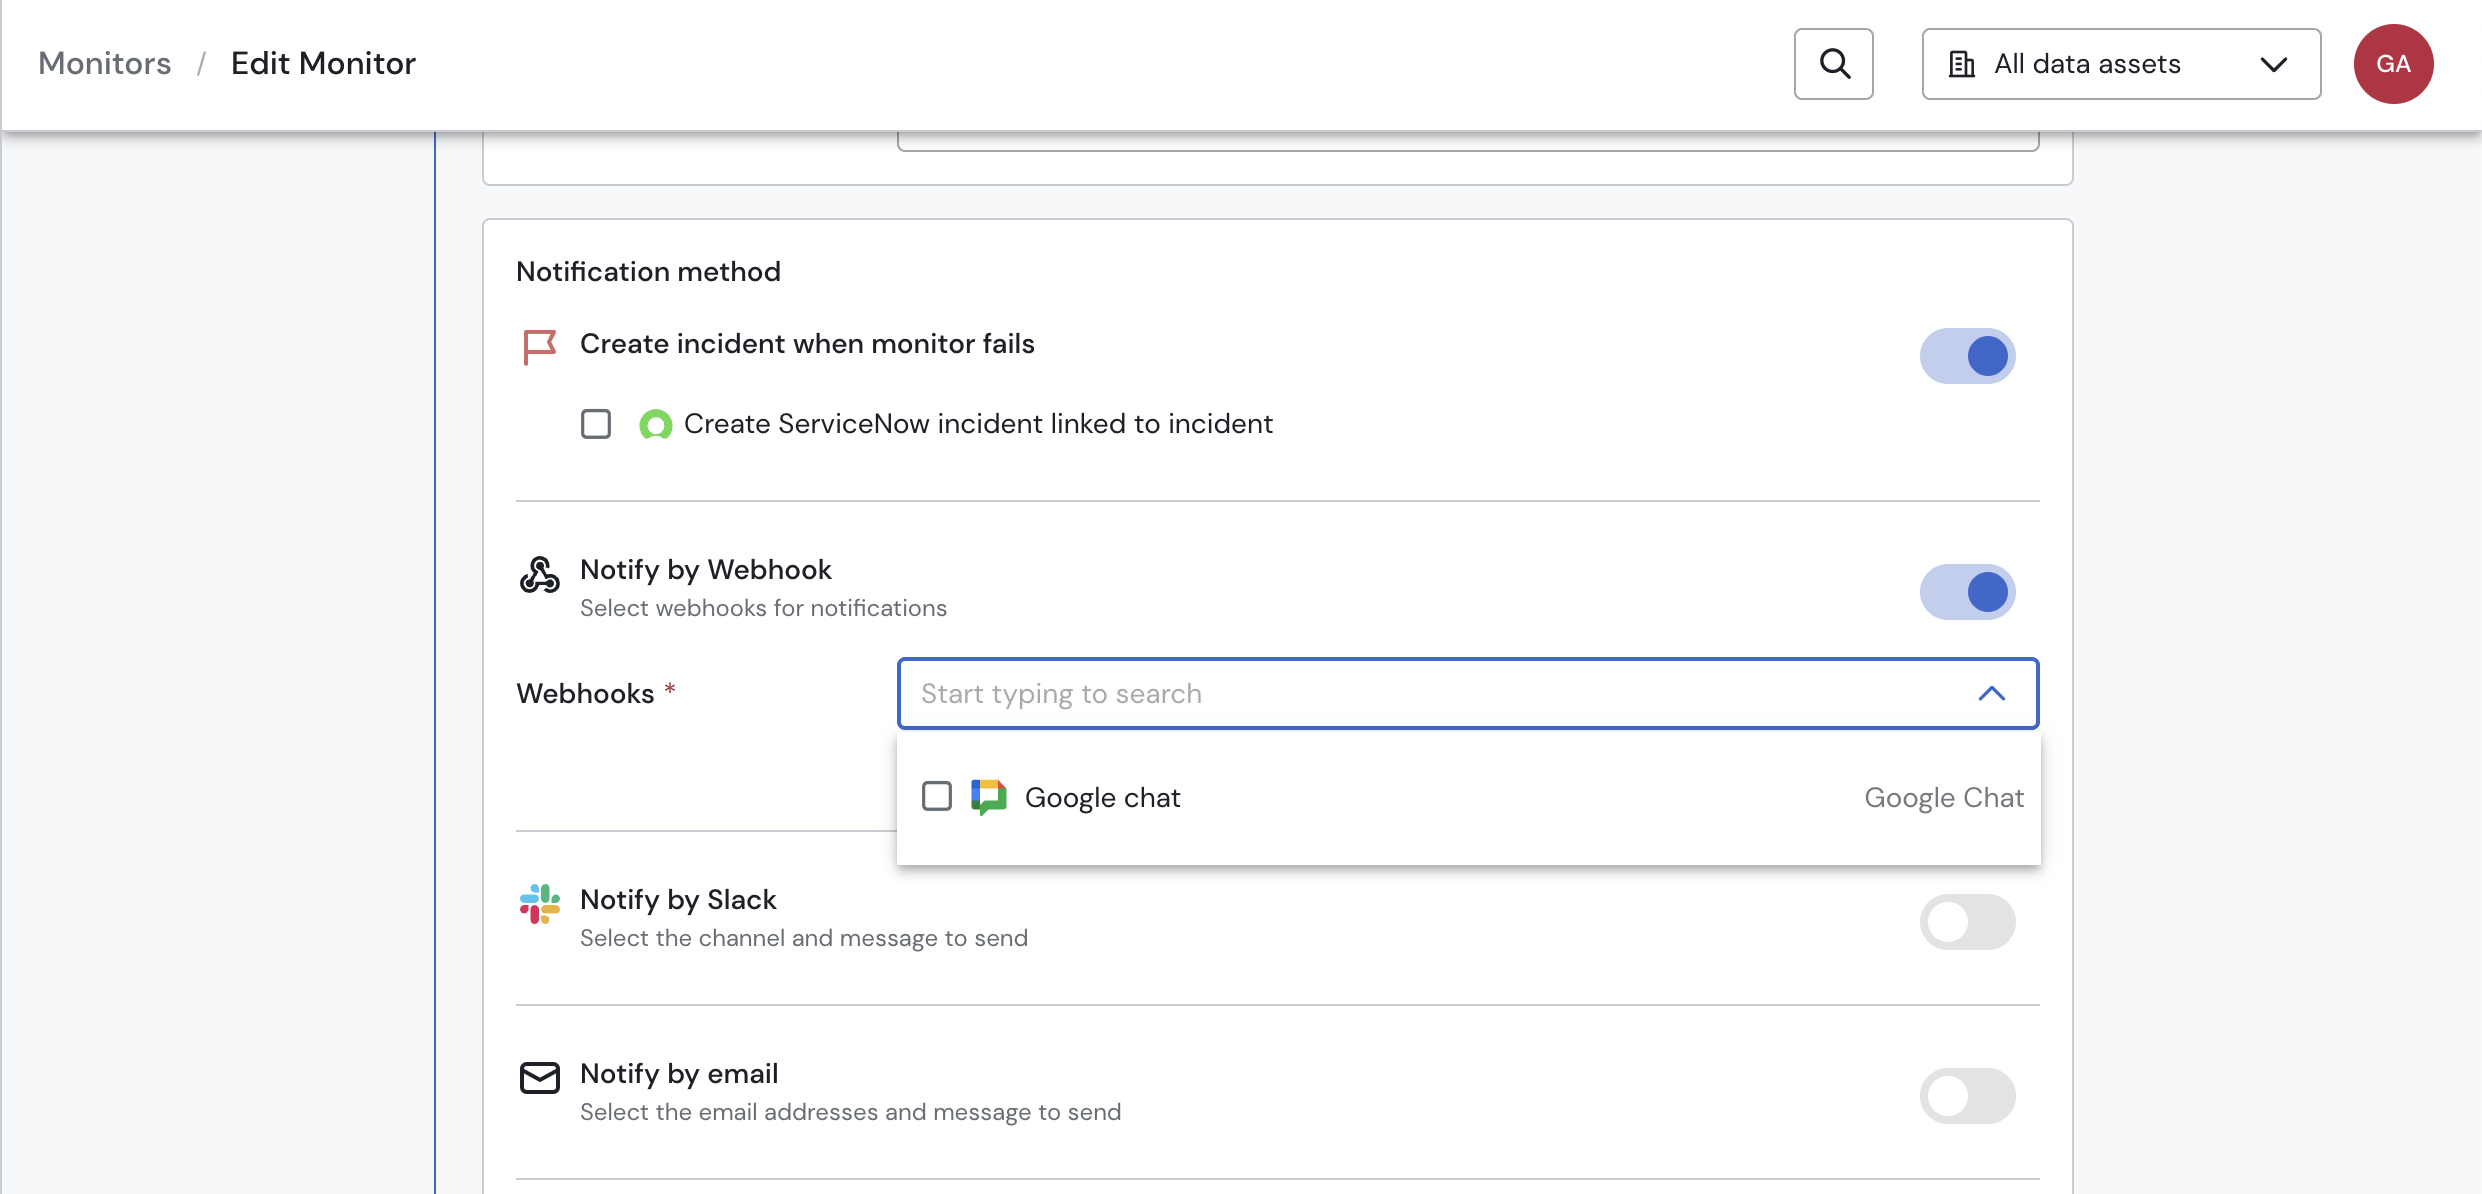
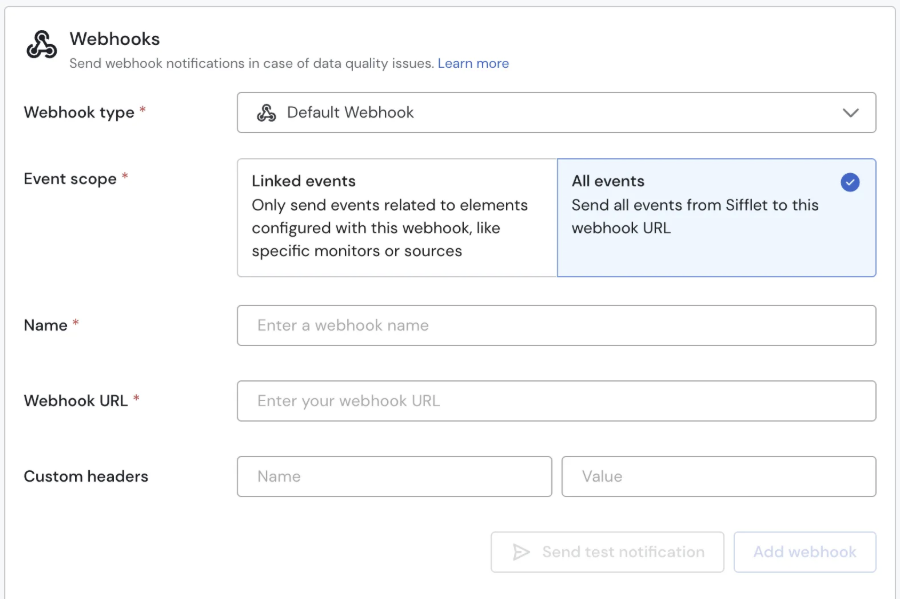
Now, when you set up a dbt integration, you'll see a new Notifications section. This lets you get real-time alerts when a dbt model fails, with notifications sent to:
Slack
Email
Microsoft Teams
Webhooks
This new capability ensures you stay informed and can address issues as they happen, minimizing downtime and the impact of data pipeline problems. You can read about the feature and how to leverage it via the dedicated documentation page.
We're thrilled to announce a massive upgrade to our Apache Airflow integration! We've moved beyond simply listing DAGs in the catalog to providing deep, actionable insights that connect your data pipelines to the assets they produce. This update gives you a complete picture of your data's journey, from orchestration to consumption.
Here’s what’s new:
✨ Airflow DAGs Directly in Your Lineage
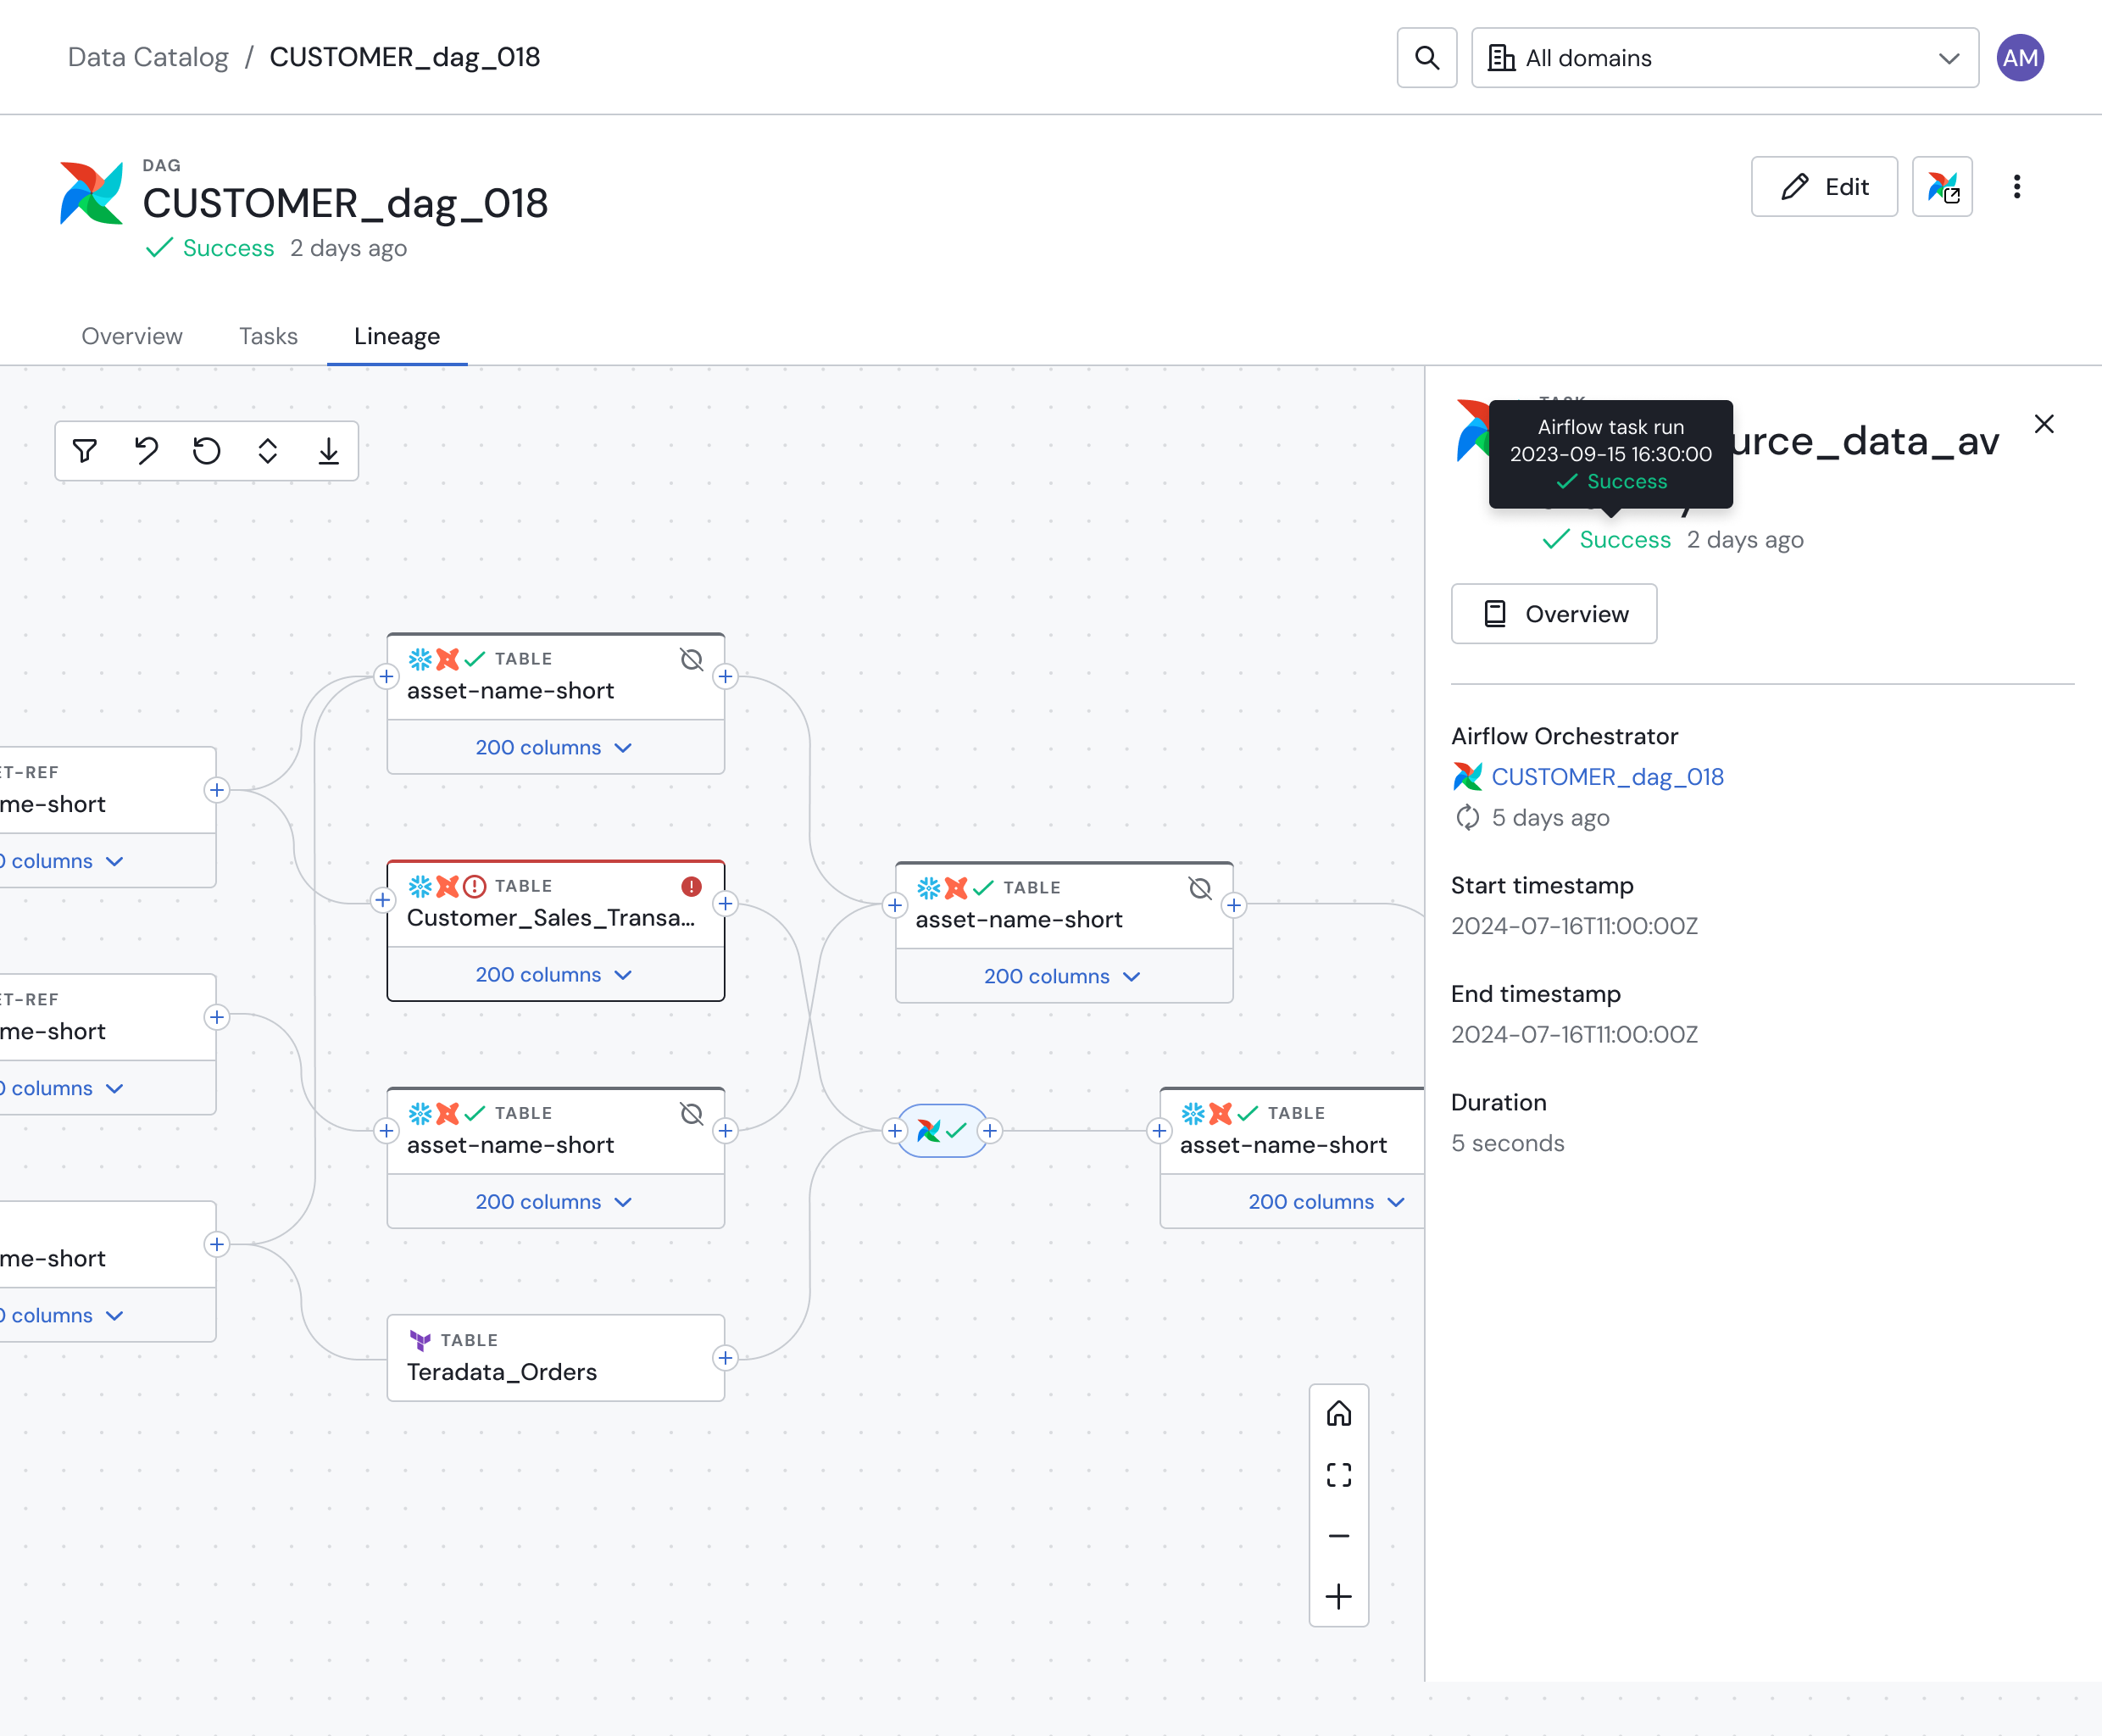
You can now visualize the direct relationship between your Airflow DAGs and your data assets. By adding a simple query tag to your Airflow operators, Sifflet will automatically map which DAGs generate or update specific tables and views. This closes a critical gap in data lineage, allowing you to instantly understand the upstream source of any asset.
Benefit: Instantly identify which pipeline populates a given dataset for faster debugging and impact analysis.
How to start: Check out our new documentation to learn how to tag your queries.
Airflow DAG within the Sifflet lineage
✅ Live Airflow DAG Status in Sifflet
No more switching between tools to check if a pipeline ran successfully. Sifflet now pulls the latest run status for each of your DAGs and displays it directly in the catalog and lineage.
Benefit: Monitor the health of your data pipelines from the same platform you use to monitor your data quality.
📄 Pipeline Context on Asset Pages
When you link a DAG to an asset, that pipeline context now appears directly on the asset's page. See which DAG is responsible for the data without leaving the asset view, and navigate to the DAG page for its description, its owner(s), and its most recent run status.
Benefit: Gain immediate, valuable context about an asset's provenance and health, empowering data consumers and accelerating root cause analysis.
🔮 What's Coming Next
This is just the beginning of our push for comprehensive pipeline monitoring. Here's a sneak peek at what our team is working on:
Smarter Root Cause Analysis: Our AI agent, Sage, will soon incorporate Airflow DAG status into its incident analysis. It will automatically flag failed or delayed DAGs as the likely root cause of data quality issues.
Task-Level Granularity: Soon, you'll be able to drill down even further with detailed metadata and status for individual Airflow tasks.
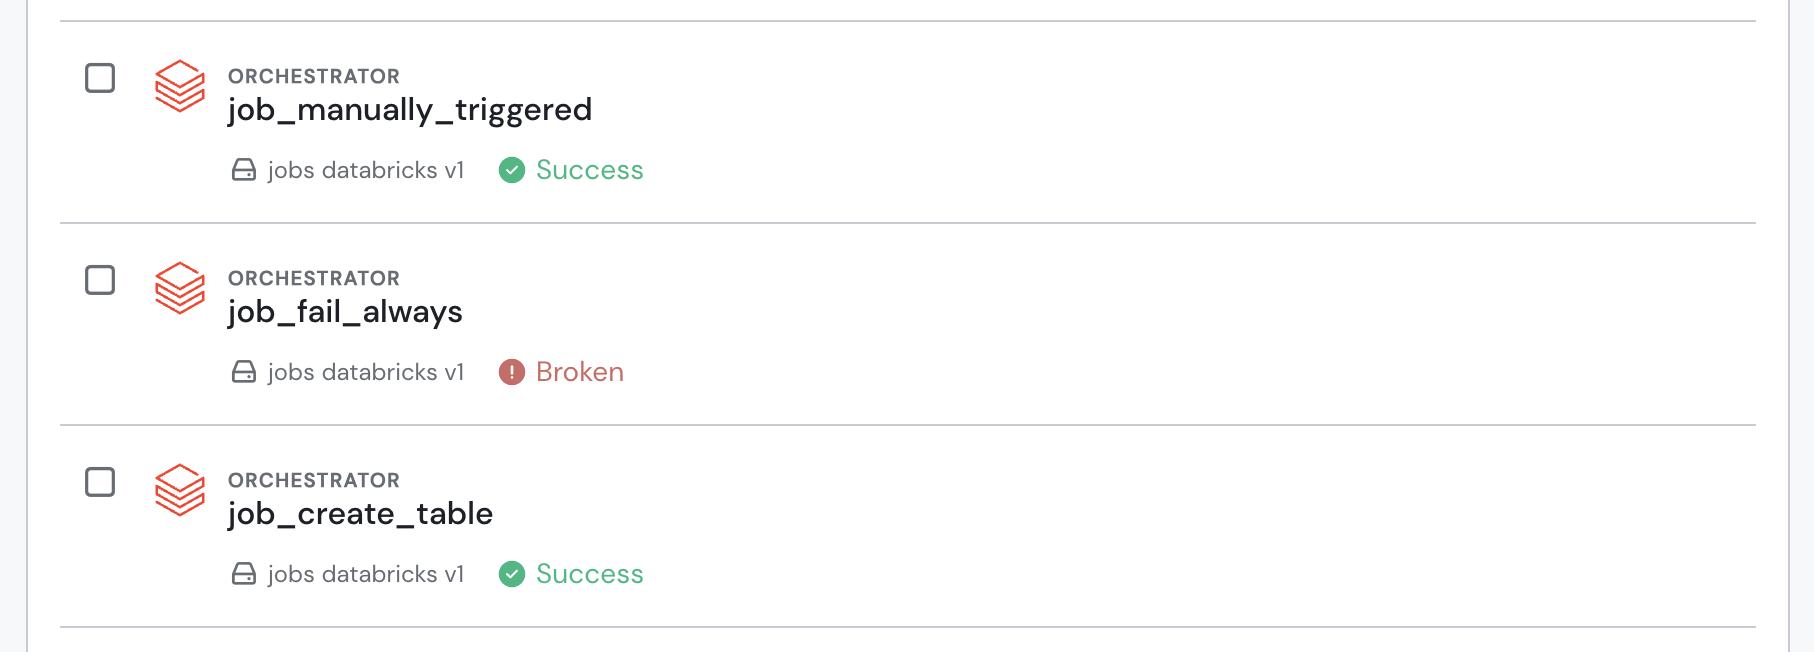
Expanded Orchestrator Support: We're bringing these same powerful capabilities to other leading workflow orchestrators, including Databricks Workflows and Azure Data Factory.
We encourage you to explore the new Airflow integration today! As always, we'd love to hear your feedback.
Edit an asset: PATCH https://{tenant}.siffletdata.com/api/v1/assets
Previously, the tags property could contain a mix of tags defined in Sifflet and tags pulled from the source.
The tags property now only contains user-defined tags in Sifflet.
A new externalTags property lists read-only tags from external systems (e.g., dbt, BigQuery, Snowflake, Databricks).
We're excited to release Automatic Incident Grouping, a new feature designed to reduce alert fatigue and accelerate your investigation process.
Intelligent Grouping: Sifflet now automatically merges related failures—from freshness and volume monitors to dbt tests—into a single, consolidated incident.
Powered by Lineage & AI: Our grouping logic leverages data lineage and an AI model to accurately identify connected issues, helping you see the full picture.
AI-Generated Descriptions: Sifflet now also provides an AI-generated summary of every incident, so you can understand the context instantly.
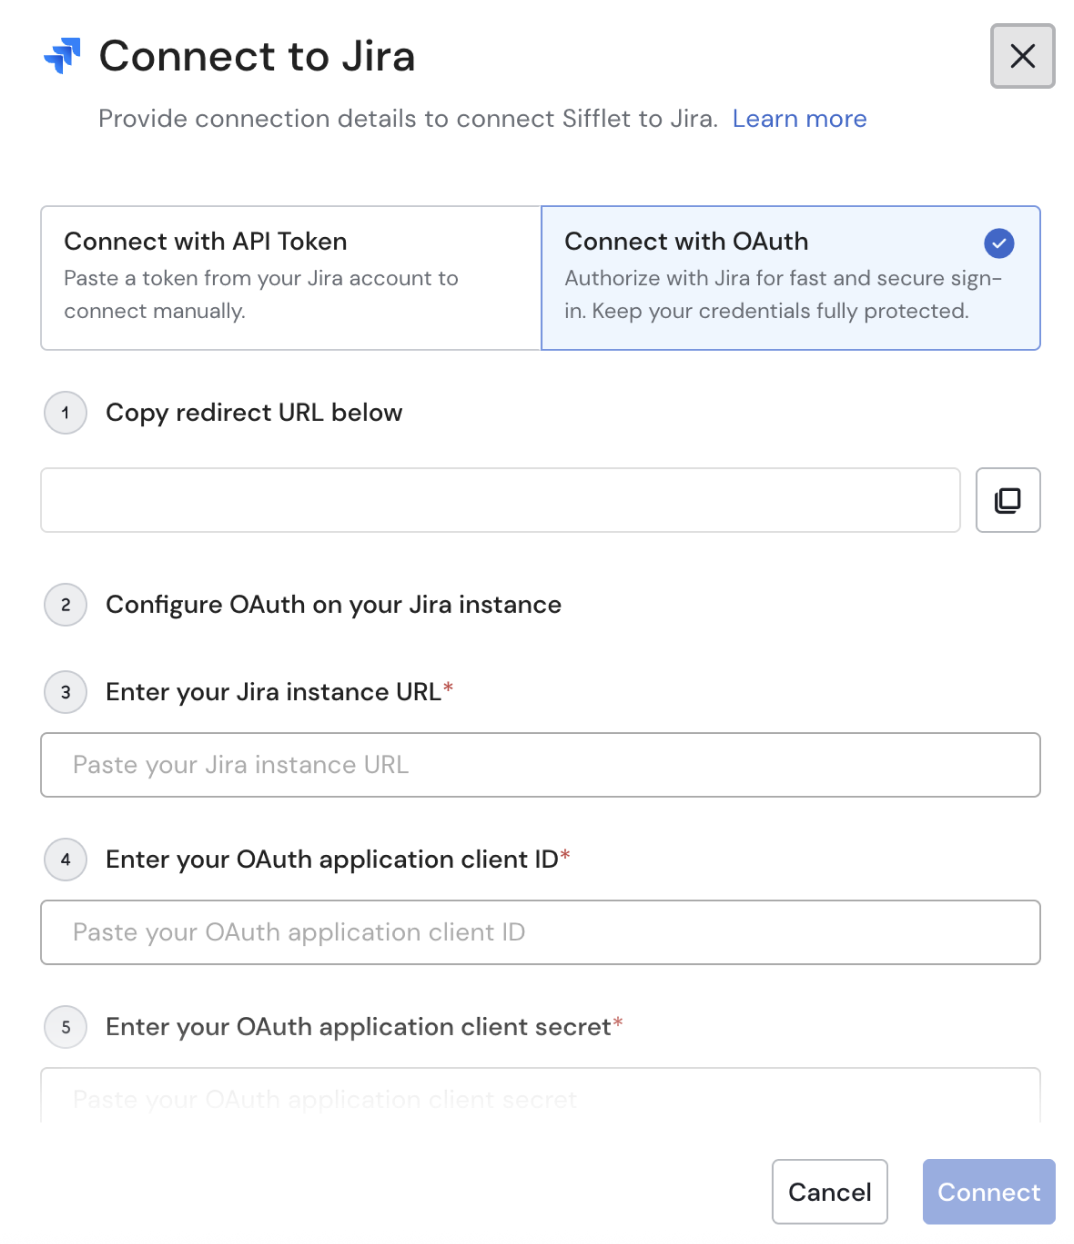
We've supercharged our Jira integration with a brand new templating feature, similar to the one available for ServiceNow.
What's new? You can now create and save templates that define the Project, Issue Type, and values for any custom Jira fields.
Why does it matter? This ensures that every Jira ticket created from a Sifflet monitor or incident is standardized, accurate, contains all relevant information, and lands in the right team's backlog without manual intervention.
How do I use it? Head to the Jira integration settings page to create your first template. You can then select it directly from the notifications settings of any monitor.
For more details on configuring custom fields, check out our updated Jira documentation.
We're excited to announce a significant improvement to how you receive email notifications from Sifflet. To help you manage alerts more efficiently and reduce inbox clutter, we've introduced threaded email updates for failing monitors.
What's Changing?
Previously, every time a monitor run resulted in a FAILING or NEEDS ATTENTION status, Sifflet would send a brand-new email. This could lead to multiple, separate emails for a single ongoing issue, making it difficult to track the history and latest status of a failing monitor.
With today's update, Sifflet's notification behavior has been streamlined:
Initial Failure: When a monitor fails for the first time, Sifflet will send a new email alert, creating a new thread.
Subsequent Updates: If the same monitor continues to fail in subsequent runs, all new notifications will be sent as replies within that original email thread.
Why It Matters
This change brings several key benefits to your workflow:
Reduced Inbox Clutter: No more separate emails for each run of a failing monitor. Your inbox stays cleaner and more organized.
Easy-to-Follow Context: All updates and alerts for a given monitor are now grouped in one conversation. This makes it much easier to track the history of a failure, see when it started, and follow its progression without having to search through multiple emails.
No action is required from you to enable this feature. It is now the default behavior for all email notifications in Sifflet. We believe this update will make managing your data quality alerts a much smoother experience.